
We can’t believe it’s been only two months since the last SDK update, but thanks to our phenomenal SDK team, we are happy to announce the newly updated Python SDK 0.4!
Ever since we launched our SDK last year, we’ve been working closely with our customers, partners, and internal users to make improvements. We’ve asked questions to learn more about how they are using SDK in their environment:
- How are they building tools?
- What are some critical features?
- Ultimately, how can we empower more engineers to start building creatively and efficiently with Ouster sensors to bring safety, mapping, and automation systems to life.
For those of you who are not familiar with our Python SDK, we made the package available last Spring to enable developers to interact with Ouster lidar sensors directly with Python. Since the launch, we’ve seen many users save time and effort working with our lidars. For example, it only takes a couple of minutes to connect and configure our sensors to visualize 3D point clouds, which tremendously accelerates the time to evaluate and build proof of concepts.
What’s Included in Ouster Python SDK 0.4
The goal of this release was to make it more stable, and these are some additions/changes:
- Updated visualizer library that exposes multiple features such as keyboard, mouse controls, window and rendering, and drawable object management
- Firmware 2.3 support that adds new data profiles (Low Data Rate Profile and Single Return Profile)
- Unified documentation for Python SDK and C++ for better understanding

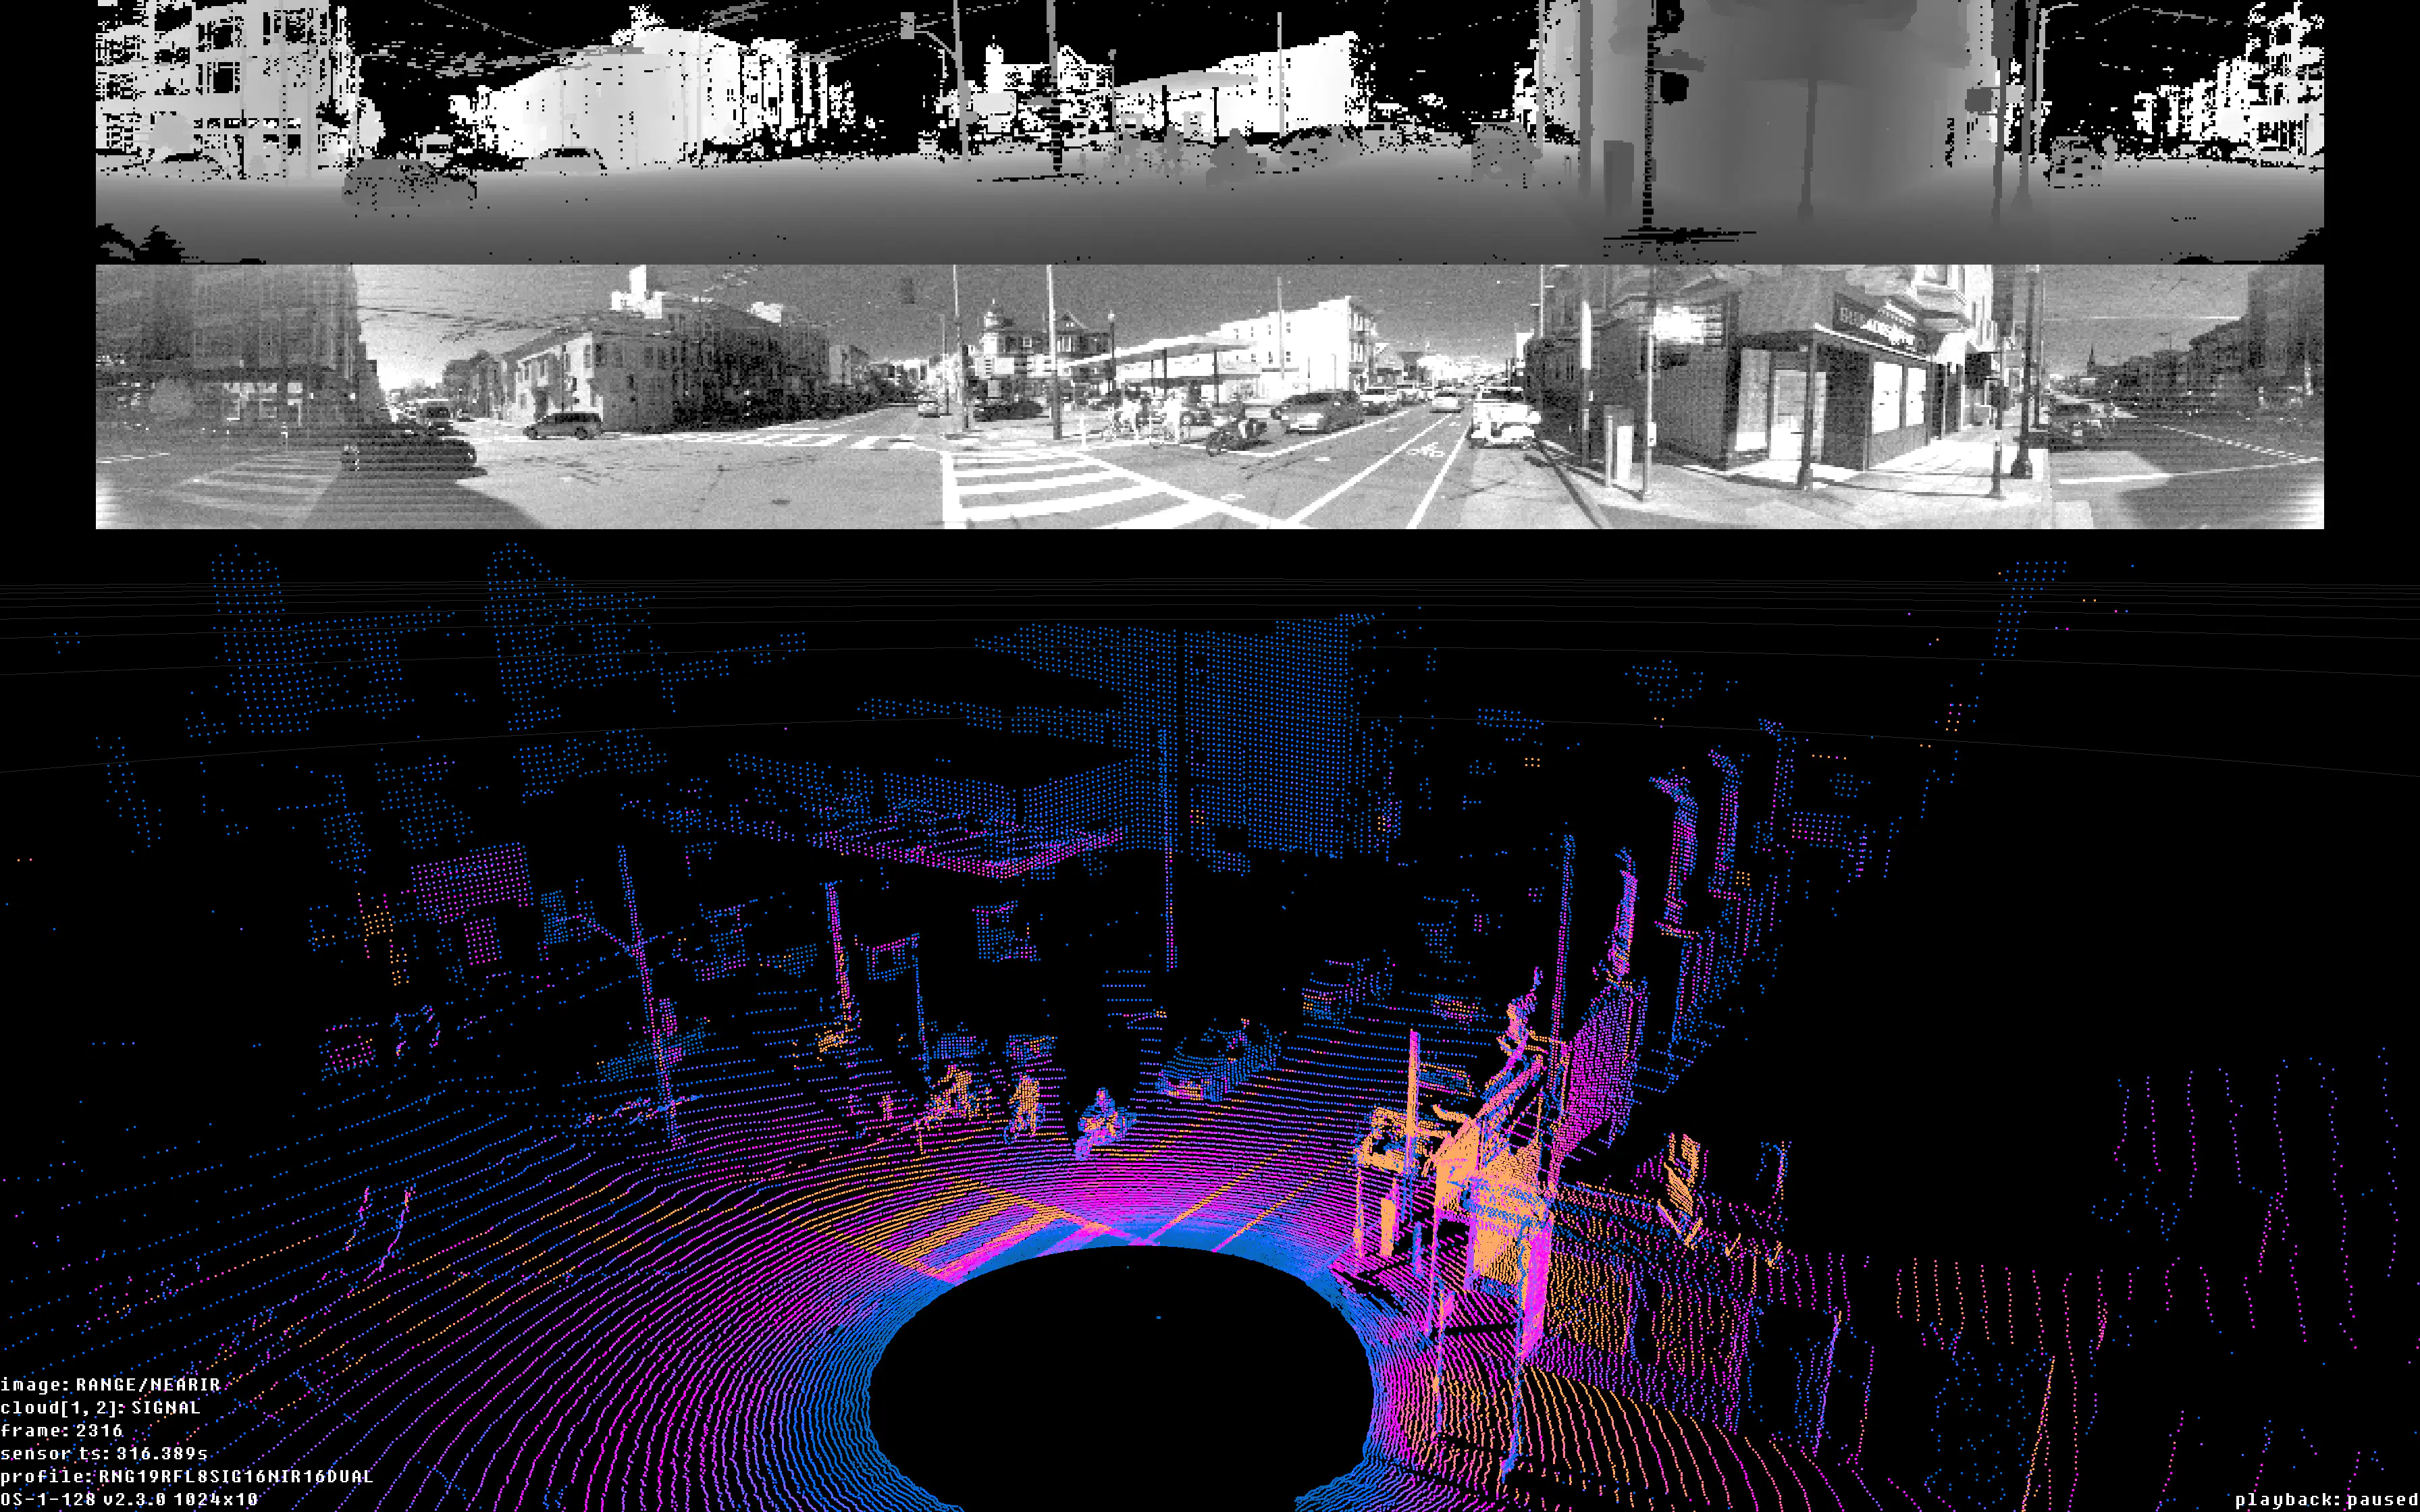
With the new visualizer, it’s now easier to view the point clouds from a live sensor or recorded PCAP files. Moreover, the window now provides an on-screen display with sensor configurations to help users analyze data faster. But please note that some of the keyboard controls have changed, so be sure to check our documentation.
We are always striving to improve our SDK and developer experience. Take a look at our collection of resources and give it a try:
Additional Sample Data Links (“Download” button in the top right): OS0, OS1, OS2
How to project into Cartesian Coordinates
How to convert a .pcap to a .csv, .las, or .pcd file
How to record and stream data from a live sensor
If you have suggestions or issues to report, please find us on Github!
Related Articles

Unlocking Federal Funding for Smart Infrastructure: Ouster BlueCity with Rev8 Achieves BABA Compliance
Ouster BlueCity with Rev8 has achieved system-level BABA (Build America, Buy America) Act compliance, clearing a major procurement hurdle for state and local transportation agencies pursuing federally funded ITS upgrades. The milestone means Ouster's lidar and edge computing hardware meet domestic manufacturing requirements, making BlueCity eligible for deployment in federally funded intersections, corridors, transit networks, and tolling systems. Combined with Rev8's native color lidar, extended range, and 10-year production life, the announcement positions Ouster BlueCity as a low-friction path to modernizing American roadways.

Privacy by Design: How Ouster BlueCity Fuses Native Color Lidar with Edge Privacy
Ouster BlueCity with Rev8 is the industry's first native color lidar detection system, giving traffic engineers up to 500 feet of advance detection and richer situational awareness at intersections. Its edge-processed AI, running on NVIDIA Orin AGX and trained on 4 million labeled objects across 800 sites, delivers 99% stop bar detection accuracy while automatically blurring pedestrians and cyclists to protect identity.

Setting a new standard in ITS: Ouster BlueCity with Rev8 steals the show at ITS America
Recap from ITS America in Detroit. Ouster BlueCity with Rev8 brings the world's first native color lidar to traffic management, delivering up to 500 feet of multimodal advance detection, with the first deployment streaming from Stamford, CT.