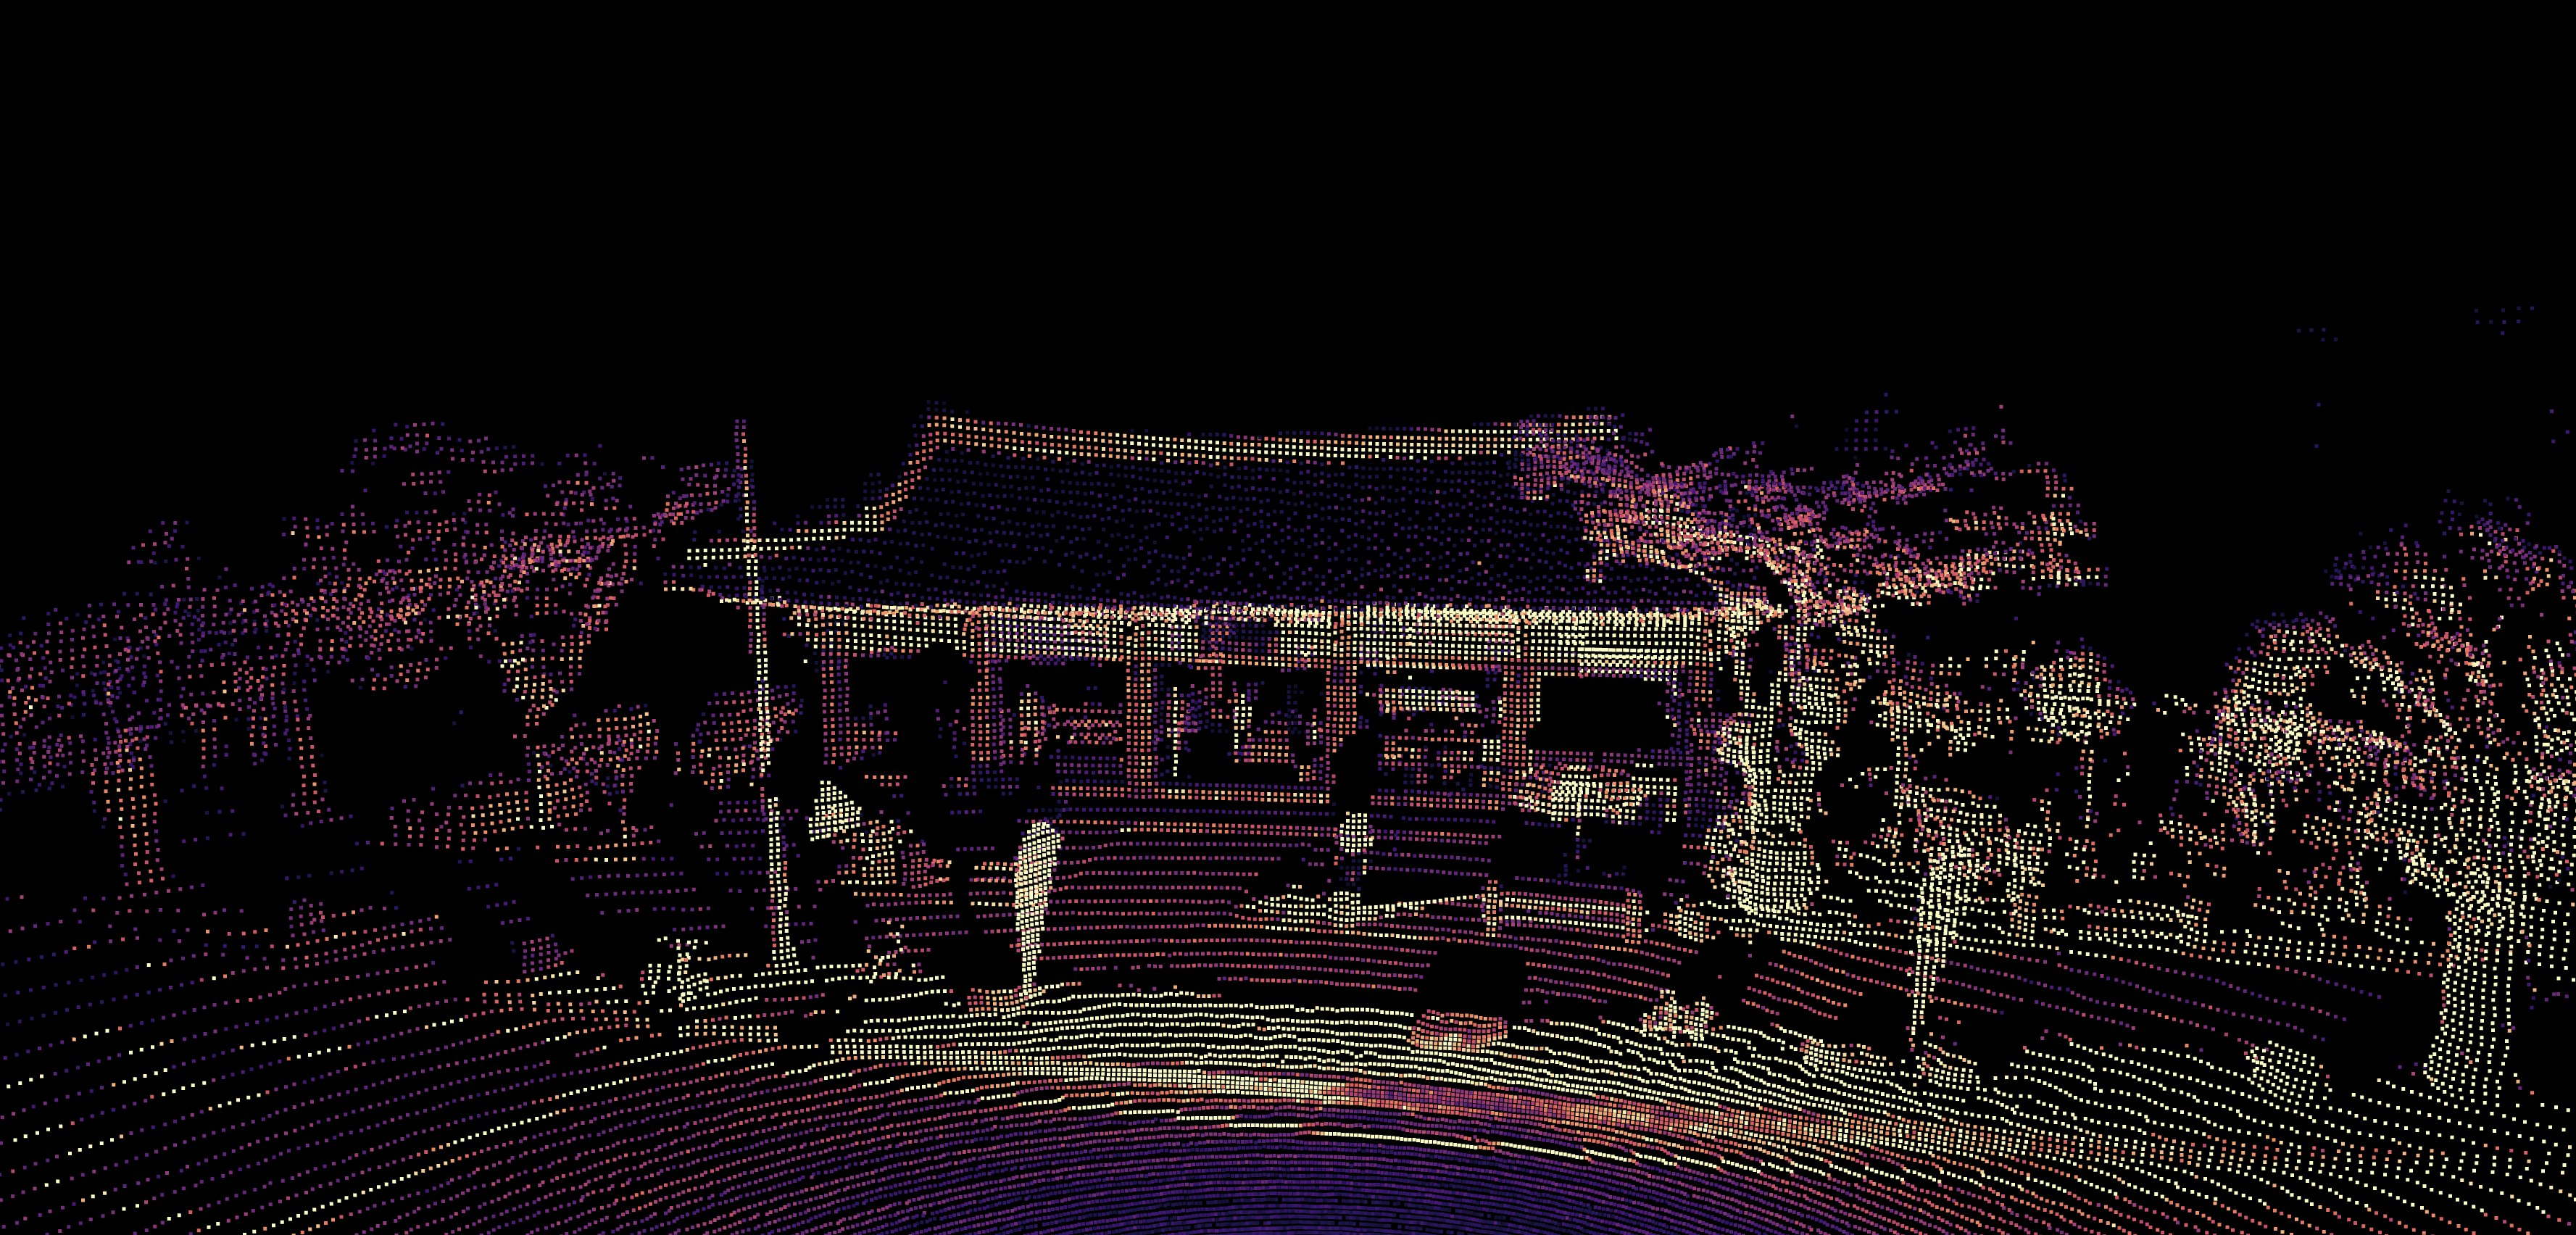
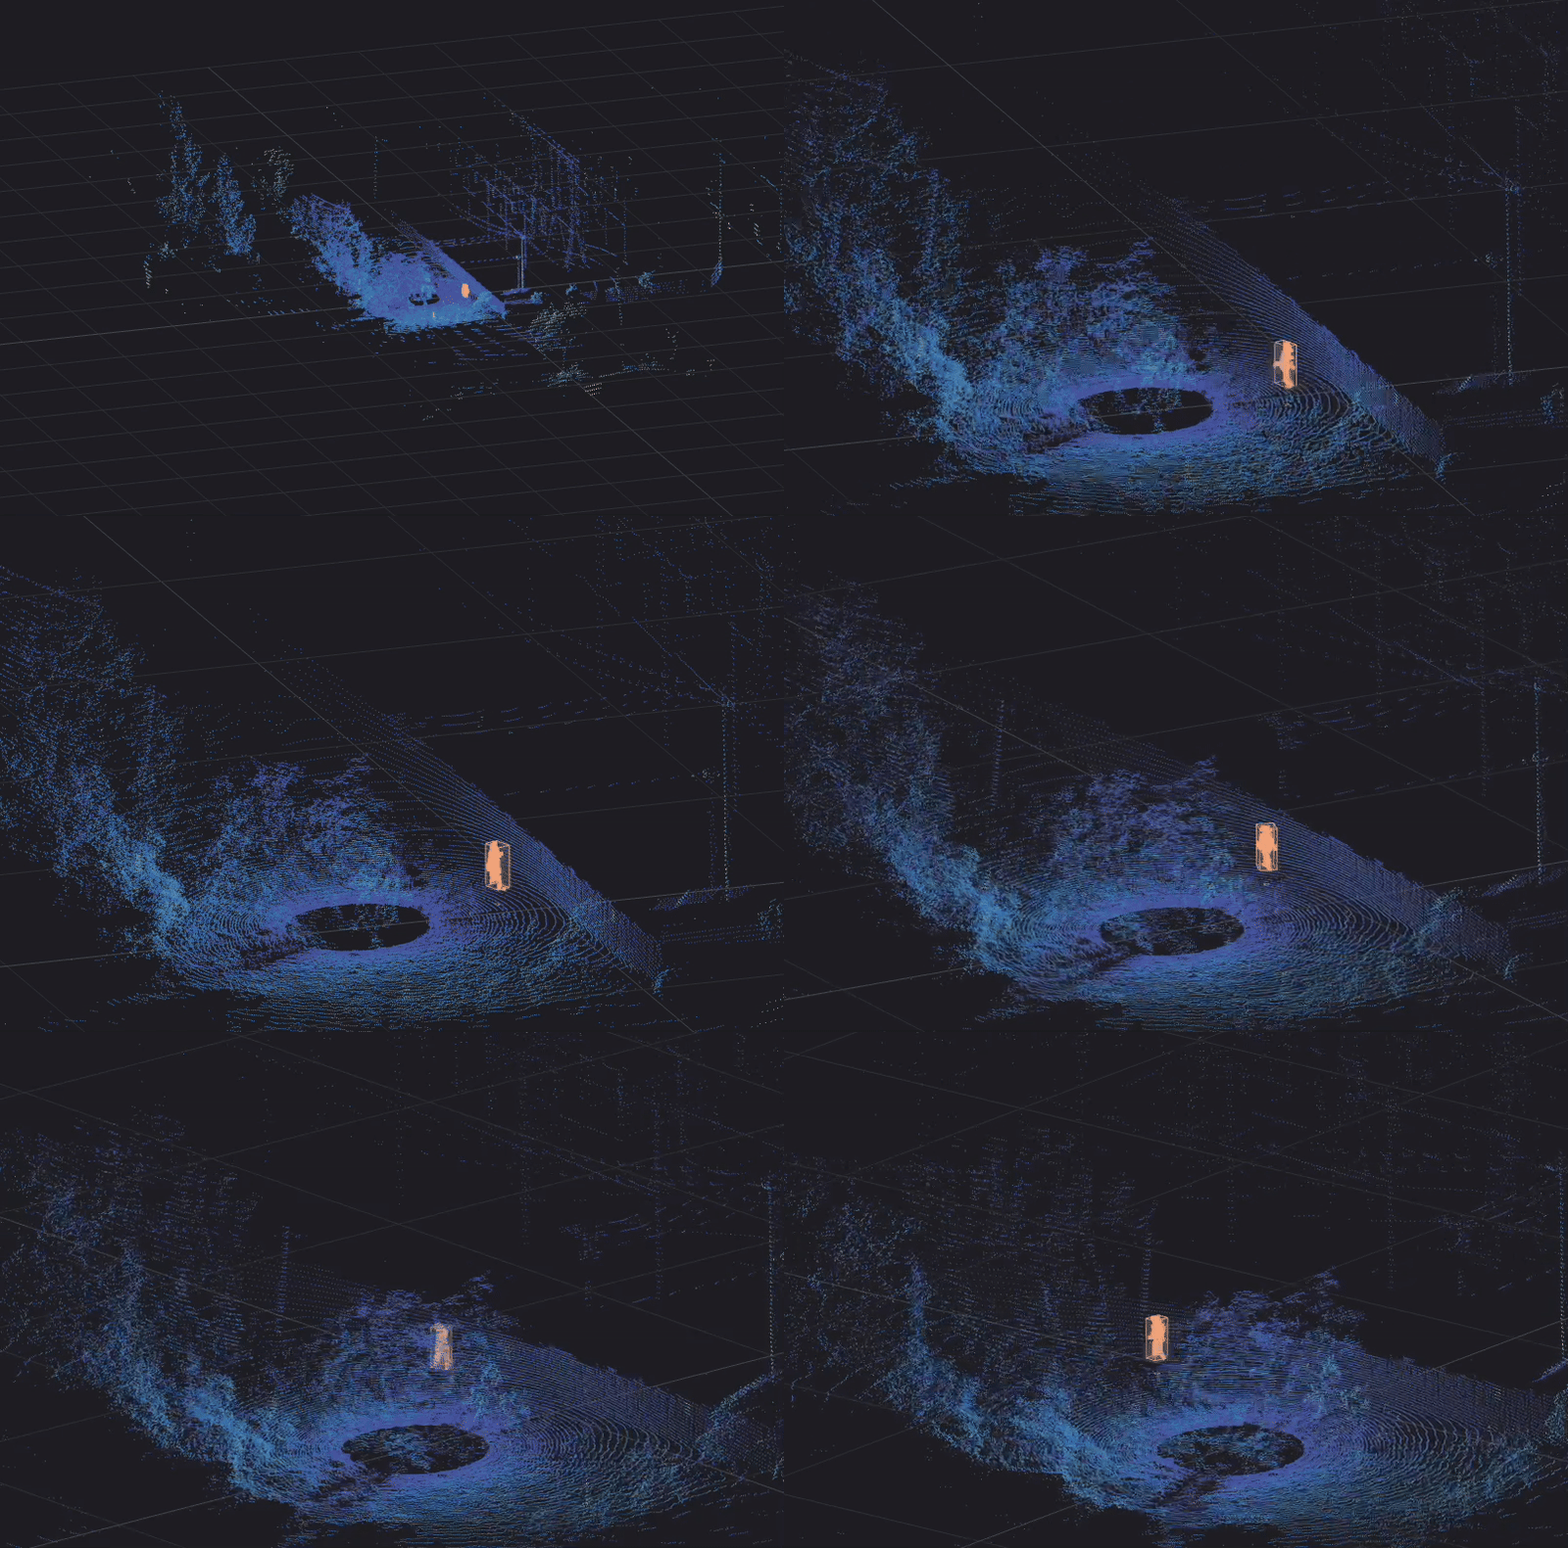
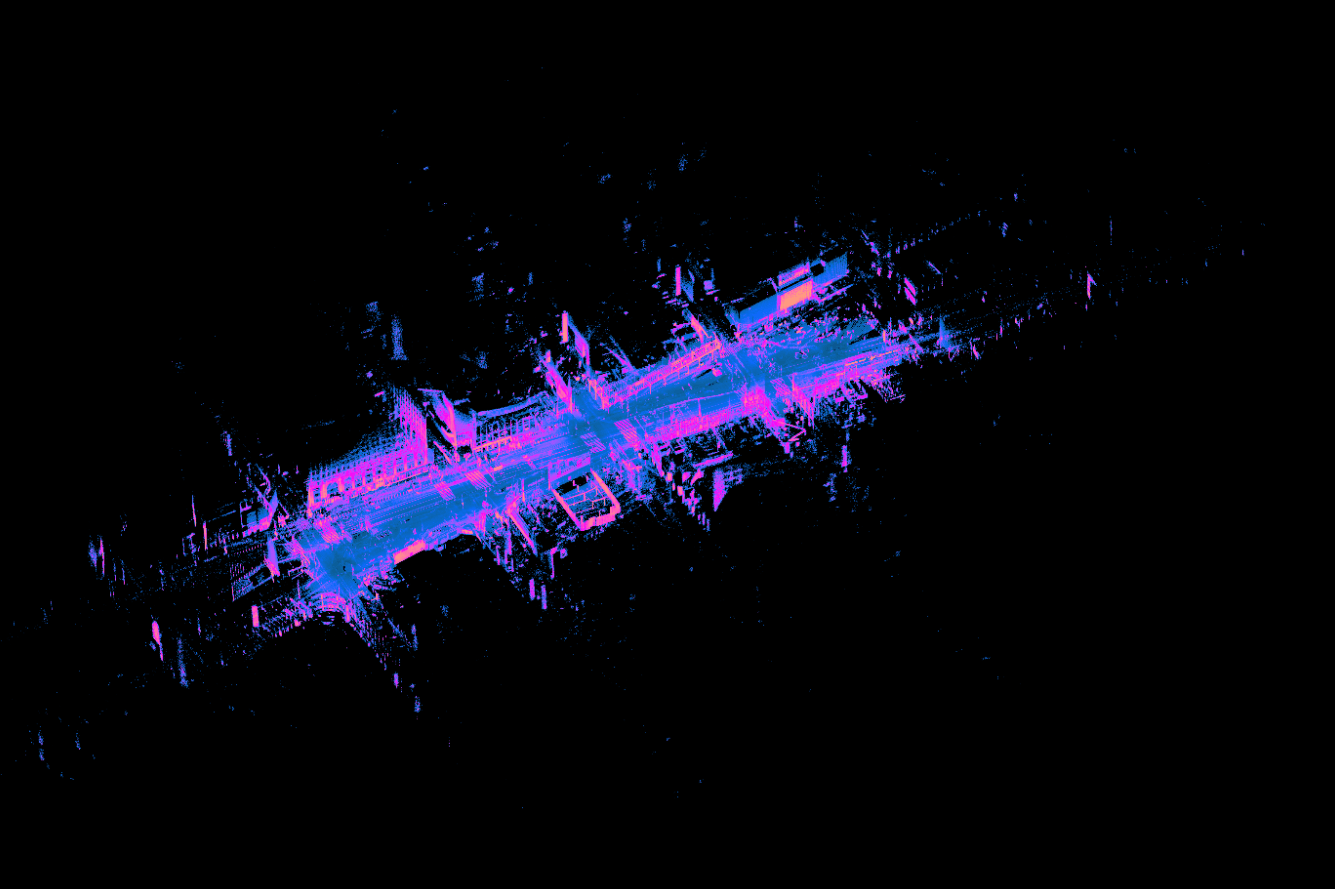
As lidar technology continues to advance, more companies are applying lidar to improve their operations. We frequently meet companies adopting lidar to reduce costs with automation and to increase safety with active alerting systems. Across nearly all of these lidar adopters, we consistently see challenges with the ease of technical evaluation.
The conventional way of working with lidar data through the raw UDP format can be difficult and time-consuming. As a result, the whole evaluation process could take several months to develop a pilot application. In fact, this was a pain point internally at Ouster as well.
So, we sought to answer the question, “How do we accelerate the time from connecting a lidar sensor to point clouds?”
To enable faster adoption of lidar technology and give tooling for engineers, we provided an example open-source C++ client. But we didn’t stop there. To make it even more accessible and easier to prototype and develop on our lidar sensors, we’ve developed the Ouster Python SDK as well!
To get started, all you have to do is pip install our package with the command (We recommend setting up a virtual environment before you begin):
Linux/macOS $ python3 -m pip install ouster-sdkWindows x64 PS > py3 -m pip install ouster-sdkAll the packages required to run the Ouster Python SDK will be installed, making it simple for both experienced and novice developers.
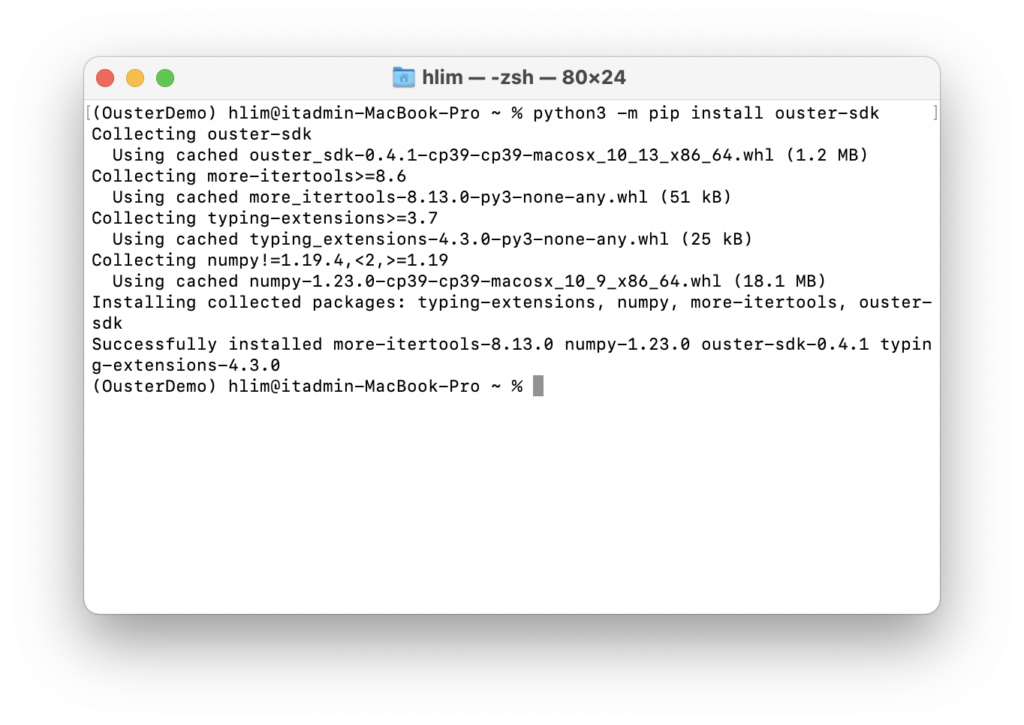
To verify that you have ouster-sdk installed, run pip list and check to see ouster-sdk in the list:
Linux/macOS $ python3 -m pip listWindows x64 PS > py -3 -m pip list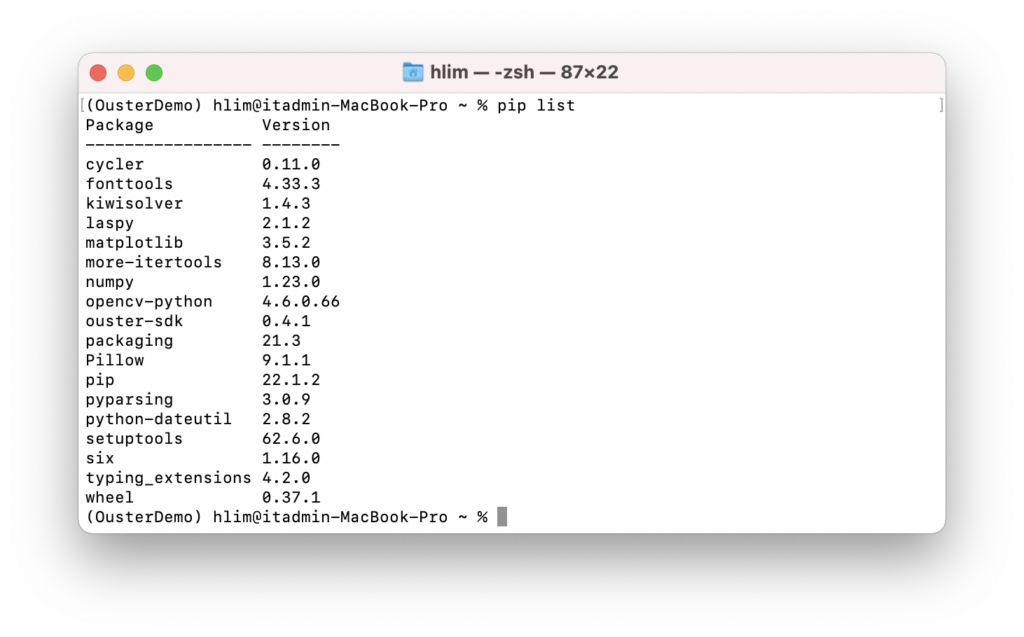
Now that you have our Python SDK installed, let’s visualize some points clouds with the command simple-viz. Using simple-viz, you can visualize both live lidar sensors and recorded files.
For a detailed description of connecting to a sensor, please refer to our Sensor Documentation. Once the sensor is configured and ready to go, try pinging the sensor by using the sensor hostname or its IP address:
Linux/macOS $ ping -c1 HOSTNAMEWindows x64 PS > ping /n 10 HOSTNAMEYou should see something like this:
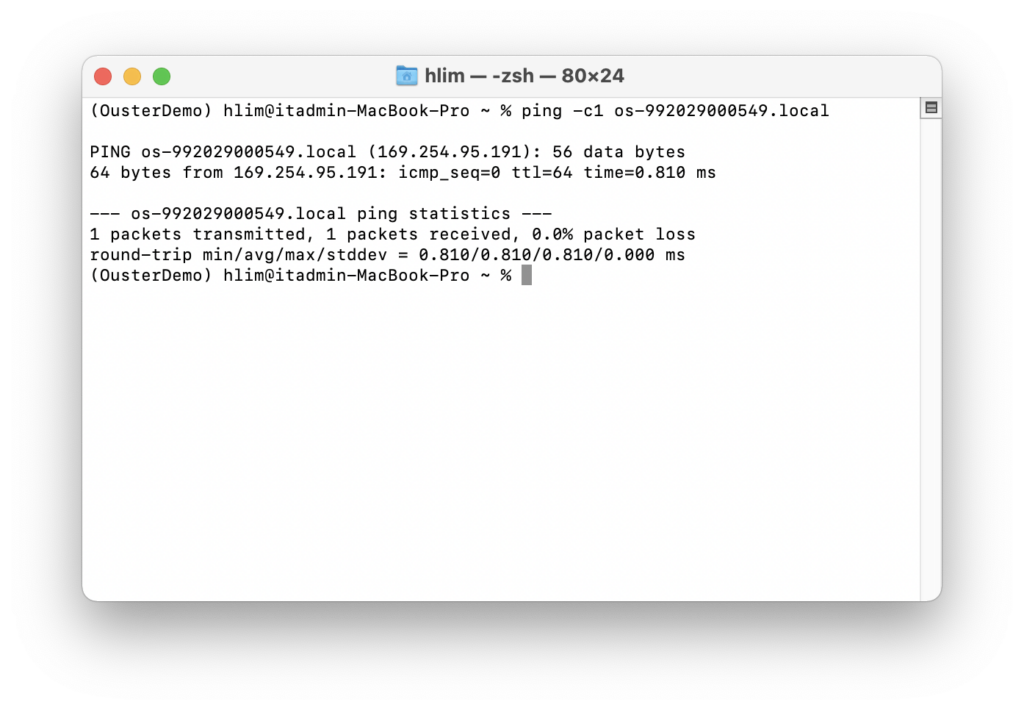
To visualize point clouds from a live sensor, simply run:
simple-viz --sensor HOSTNAMEFor example, if the hostname is os-992029000549.local, then you would run:
simple-viz --sensor os-992029000549.localIf you don’t have our sensor, don’t worry. We have plenty of sample data that you can download and visualize. Let’s use this sample data for the demo.
Inside, you will find two files
- OS1-128_Rev-06_fw23_Urban-Drive_Dual-Returns.pcap
- OS1-128_Rev-06_fw23_Urban-Drive_Dual-Returns.json
For those who are new to our data structure, the PCAP file contains the lidar and IMU packets captured over the network, and the JSON file has the metadata needed for interpreting the packet data. Naturally, when you record lidar data yourself using the SDK, you will find the two files in the directory.
To visualize from files, you can simply run:
simple-viz --pcap PCAP_FILEPATH --meta JSON_FILEPATHWith our sample files, you would have:
simple-viz --pcap OS1-128_Rev-06_fw23_Urban-Drive_Dual-Returns.pcap --meta OS1-128_Rev-06_fw23_Urban-Drive_Dual-Returns.jsonWhen you run the command, you will be greeted with the Ouster SDK Visualizer window filled with point clouds! Very easy and it only took minutes to accomplish this simple visualizer up and running.
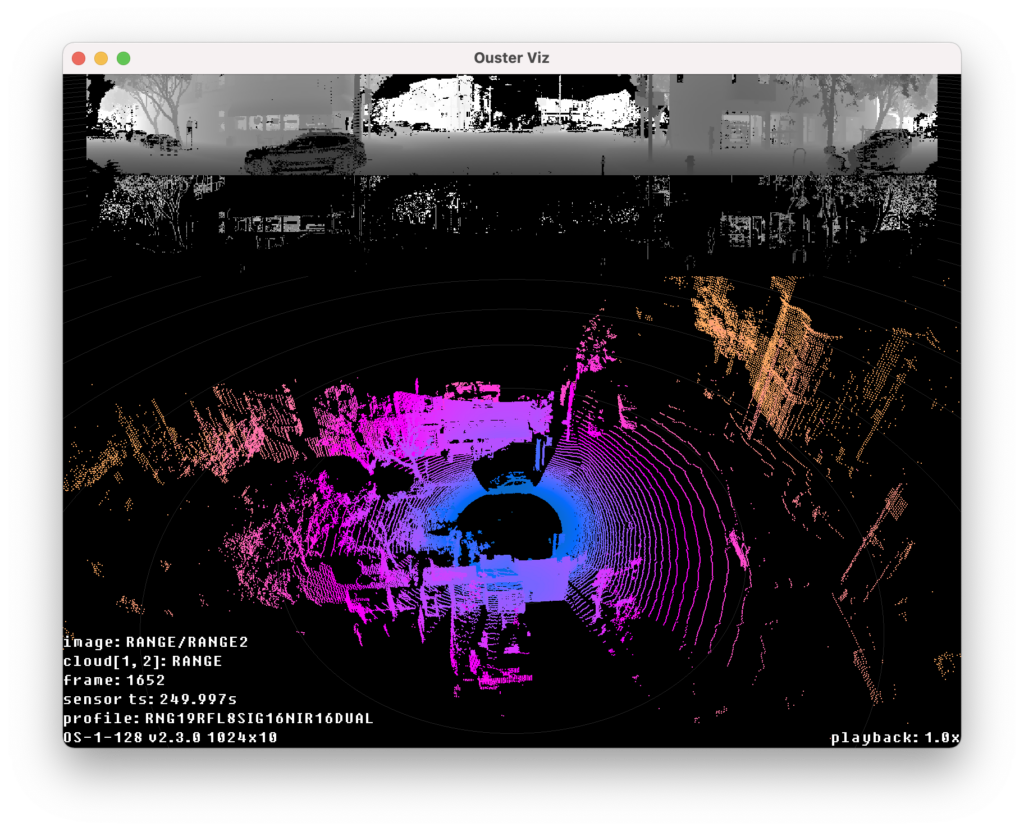
With the Ouster Python SDK, it’s much faster and easier to visualize point clouds to verify the setup of the lidar sensors and evaluate the suitability of the sensors for a specific use case. In the next post, we’ll dive deeper into the visualizer and talk about how to manipulate and interpret what you’re seeing in the point cloud. If you want to start ahead, visit our documentation site. If you have any questions, feel free to visit our GitHub page and contact us.
