Welcome back to the final part of Ouster’s blog series for October’s National Pedestrian Safety Month, led by the National Highway Traffic Safety Administration (NHTSA). The series has so far covered outside of crosswalk (jaywalking) pedestrian safety events and intersection near miss detection. In this final installment, the impact and challenges of red light running will be examined, along with an effective ITS solution that cities and transportation authorities can deploy to address this issue and enhance road safety.
The high impact of red light running
Red light running occurs when drivers ignore traffic signals and proceed through intersections after the light has turned red. This dangerous behavior not only jeopardizes the safety of drivers and passengers but also poses significant risks to pedestrians, particularly between 8 am and 4 pm when 43% of red light crashes are most likely to occur.
Red light running plays a significant role in overall vehicle crashes, which remain the leading cause of death for individuals aged 1 to 54 in the United States. The American Automobile Association (AAA) estimates that over 1,000 lives are lost annually in the U.S. due to red light running, with half of the victims being passengers, pedestrians, cyclists, or occupants of other vehicles, and not the offending drivers. A second study by the Insurance Institute for Highway Safety (IIHS) reported that more than 100,000 individuals suffered injuries from red light running incidents in 2022. With more than half of Americans admitting to running red lights, cities and transportation agencies are encouraged to take proactive measures to prevent red light running, including ensuring the accurate detection of red light violations.
How is red light running detected and managed today?
Cities and transportation authorities employ various common strategies to detect and manage red light running:
Cameras: Many urban areas have installed red light cameras that automatically capture images of vehicles that run red lights. These cameras typically record the vehicle's license plate, allowing for the issuance of fines to offenders.
Traffic signal systems: Advanced traffic signal systems can monitor traffic flow and adjust signal timings to enhance safety at intersections. Some systems are equipped with sensors that detect the speed of approaching vehicles and can trigger extended yellow light durations in certain circumstances.
Law enforcement patrols: Police officers are often deployed to high-risk intersections to enforce traffic laws. While effective, this approach requires significant resources and may not be sustainable in the long term.
Despite these efforts, the detection and management of red light running face several challenges:
Data collection and analysis: While cameras and sensors collect valuable data, processing and analyzing this information can be extremely complex and requires significant manual effort and aggregated data sources. The challenges associated with integrating data from multiple sources often leads to gaps in understanding traffic patterns and behavior. Additional issues using cameras for road safety events were discussed in part two of our blog series here.
Privacy concerns: The use of traffic cameras raises privacy issues among communities. Balancing public safety with the right to privacy is a delicate challenge that municipalities must navigate carefully.
Technical and budget limitations: Existing traffic signal systems may not always accurately detect or respond to real-time conditions. For example, adverse weather conditions can impair camera performance, and some sensors may fail to recognize vehicles in certain scenarios based on the field of view, resolution and depth of perception. Implementing and maintaining advanced traffic management systems requires significant investment. Many cities operate under budget constraints, making it difficult to prioritize these essential safety measures.
The role of Ouster BlueCity in detecting red light violations
Ouster BlueCity is a lidar-enabled turnkey solution for ITS, which combines Ouster’s high-resolution 3D digital lidars with advanced perception software to detect and record data analytics for traffic actuation and road safety, including red light runners. Data is made available through the Ouster BlueCity cloud-based dashboard without the need to use other external aggregated data sources or technologies. By accessing accurate data, cities and transportation authorities can better determine which safety interventions to implement to reduce fatalities and accidents.
How Ouster BlueCity works for red light running:
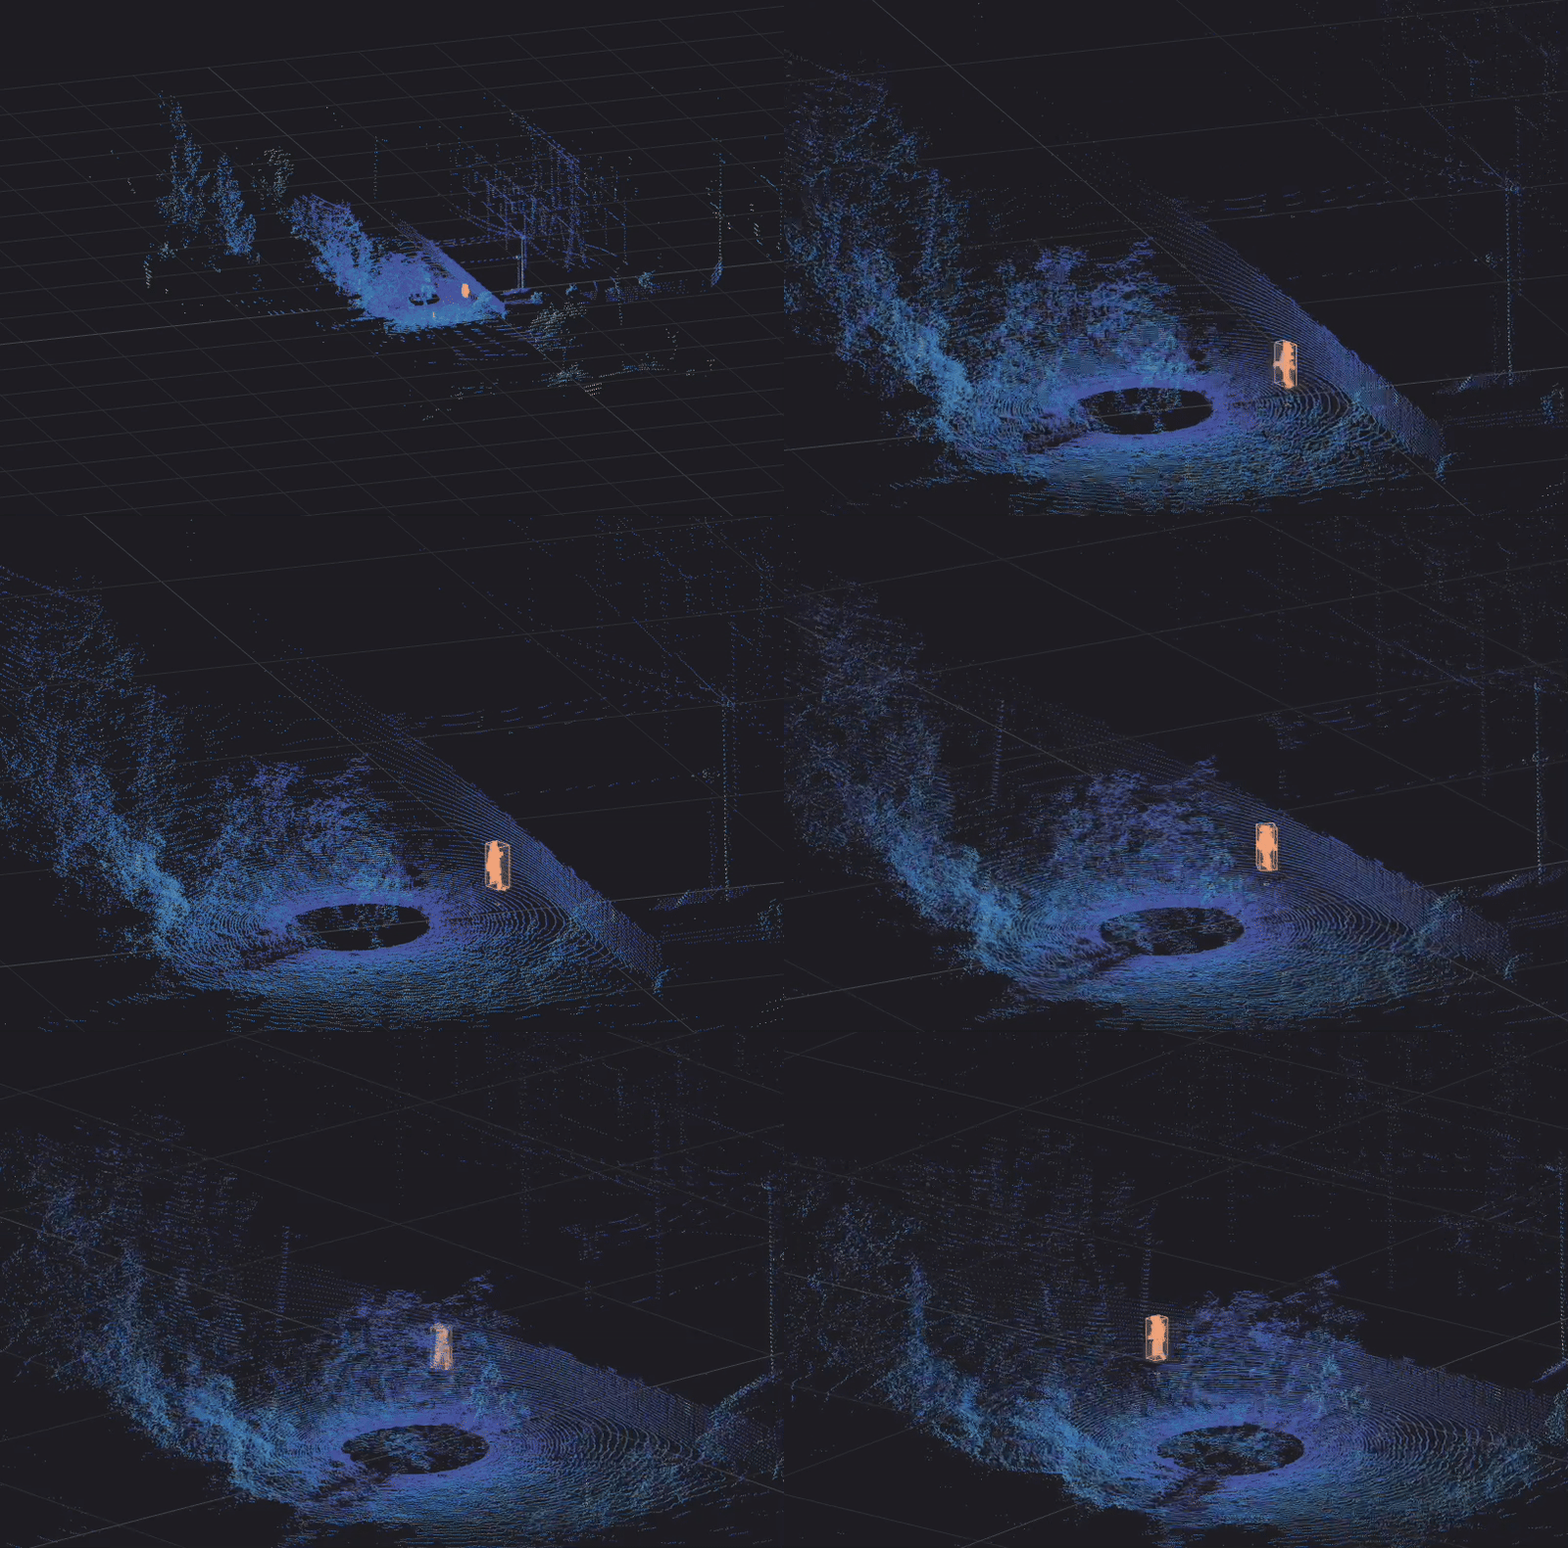
1. Install: Ouster digital lidar sensors can be easily installed on intersections or roads where road users and pedestrians may be most vulnerable. Rich point cloud data from one or multiple digital lidars provides a 3D digital traffic twin, which is shown in the below image. Following the install, detection and classification of road users begins. Multiple road user metrics are captured (e.g. road user type, speed, distance, direction and count etc.).
2. Connect system to traffic controllers and set parameters: In the Ouster BlueCity configuration tool, users can easily connect to NTCIP (National Transportation Communications for Intelligent Transportation Systems Protocol) and SDLC (Synchronous Data Link Control). This connection enables Ouster BlueCity to receive traffic light status (green, yellow and red lights) as frequently as every 100 milliseconds.
Users can then set traffic controller parameters with an SNMP port, which identifies and sends SNMP data transfers, commands, and messages from the traffic controller to Ouster BlueCity.
The connection and parameter steps allow for a seamless, real-time interaction between traffic signals and Ouster BlueCity.
3. Define vehicle approach phases: Within the Ouster BlueCity configuration tool, users can define allowed turning movements for each phase during green and red time. These rules will be used by the perception software to determine if a vehicle is violating the allowed movement or not.
4. Defining virtual loops: Once the phases are set, a stop-bar virtual loop known as a ‘presence’ loop is drawn using the configuration tool. Presence loops are assigned to a specific phase and approach. The algorithm will use the location of vehicles, along with the phase status to determine if the vehicle enters the intersection during a green, yellow or red light. If a vehicle enters during a red light, and the turning movement is not allowed during the phase, an event (RLR) is registered with other attributes such as class of vehicle, turning movement, timestamp, etc.
5: Red light violation recordings: When a vehicle approaches a predefined loop (crossing the stop bar) while the light is yellow or red, it is a violation of the established rules. The system automatically triggers a recording of the violation and captures relevant data. These recordings are made available for post-violation analysis, enabling cities to gain insights into the circumstances surrounding safety incidents.
Example red light incident recorded in Ouster BlueCity
Red light running data in the Ouster BlueCity dashboard
By logging into the Ouster BlueCity cloud-based dashboard, users can view comprehensive data that highlights red and yellow light violations per intersection. These violations can be downloaded for in-depth analysis, capturing a variety of data points over specified time periods:
Traffic light status when a car, bus or truck entered the intersection
Individual chart for each phase number
Vehicle class type
Movement direction
'Enter at' data shows the number of seconds after the light turns to red that the car entered the intersection
'Exit at' data shows the number of seconds after the light turns to red that the car exited the intersection
The video showcases red and yellow light data in Ouster BlueCity per installment. The scatter graph captures the duration and time of day of each yellow and red light violation. Users can also analyze data in the list view, and play recordings of each red light violation. In addition, further data can be downloaded into an excel file.
Looking forward: Enhancing pedestrian and road safety with Ouster BlueCity
In the past three blogs, we have explored important pedestrian and vehicle safety challenges at intersections, including outside crosswalk (jaywalking) events, near-miss incidents, and red light running. However, Ouster BlueCity offers so much more. The solution serves as a one-stop shop for your ITS needs; following a simple installation, it can address a wide range of requirements, from intersection and highway safety to tolling and traffic actuation. Together, we can create safer, smarter roads.
To discover how Ouster BlueCity can enhance intersection and road safety in your community, request a demo call today.
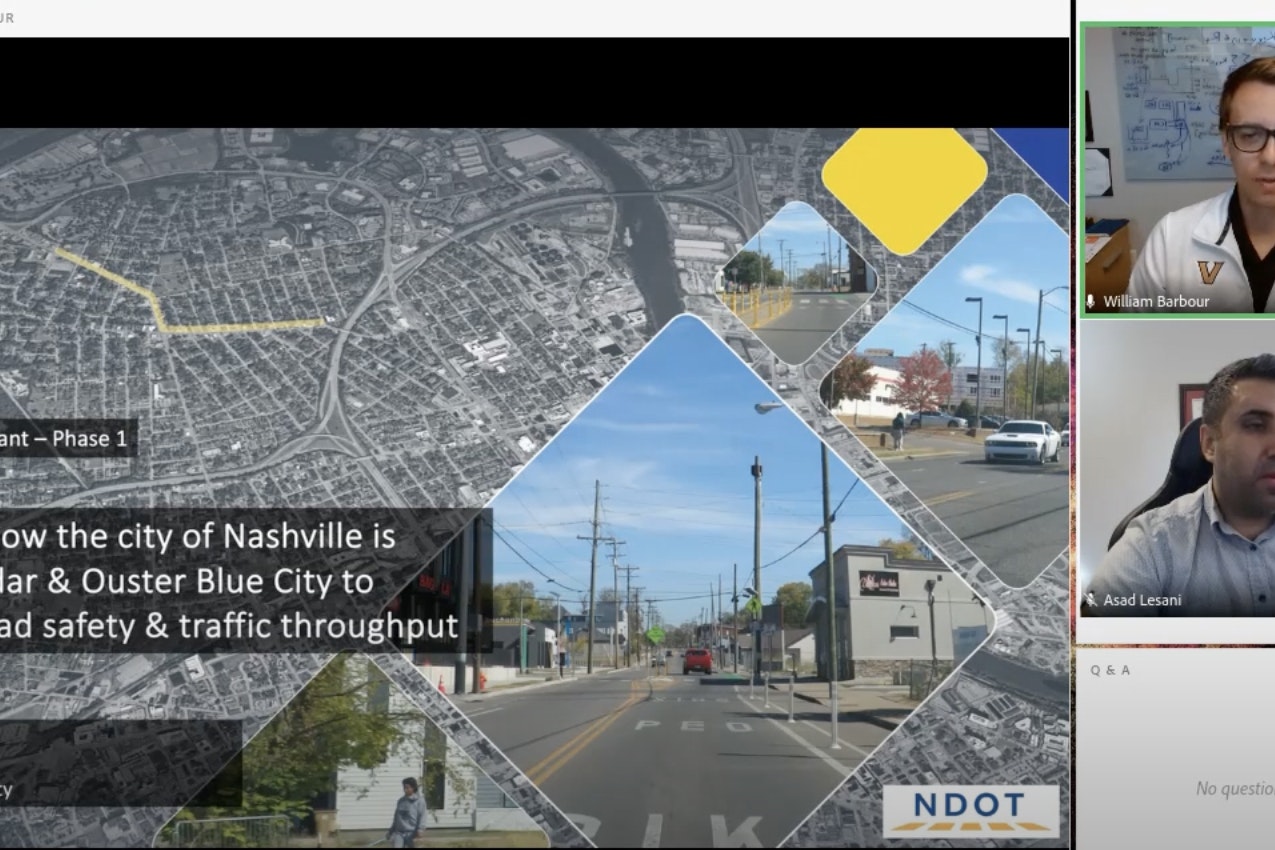
Learn why Nashville and Vanderbilt University deployed Ouster BlueCity to help solve road safety and traffic needs in this webinar replay.


