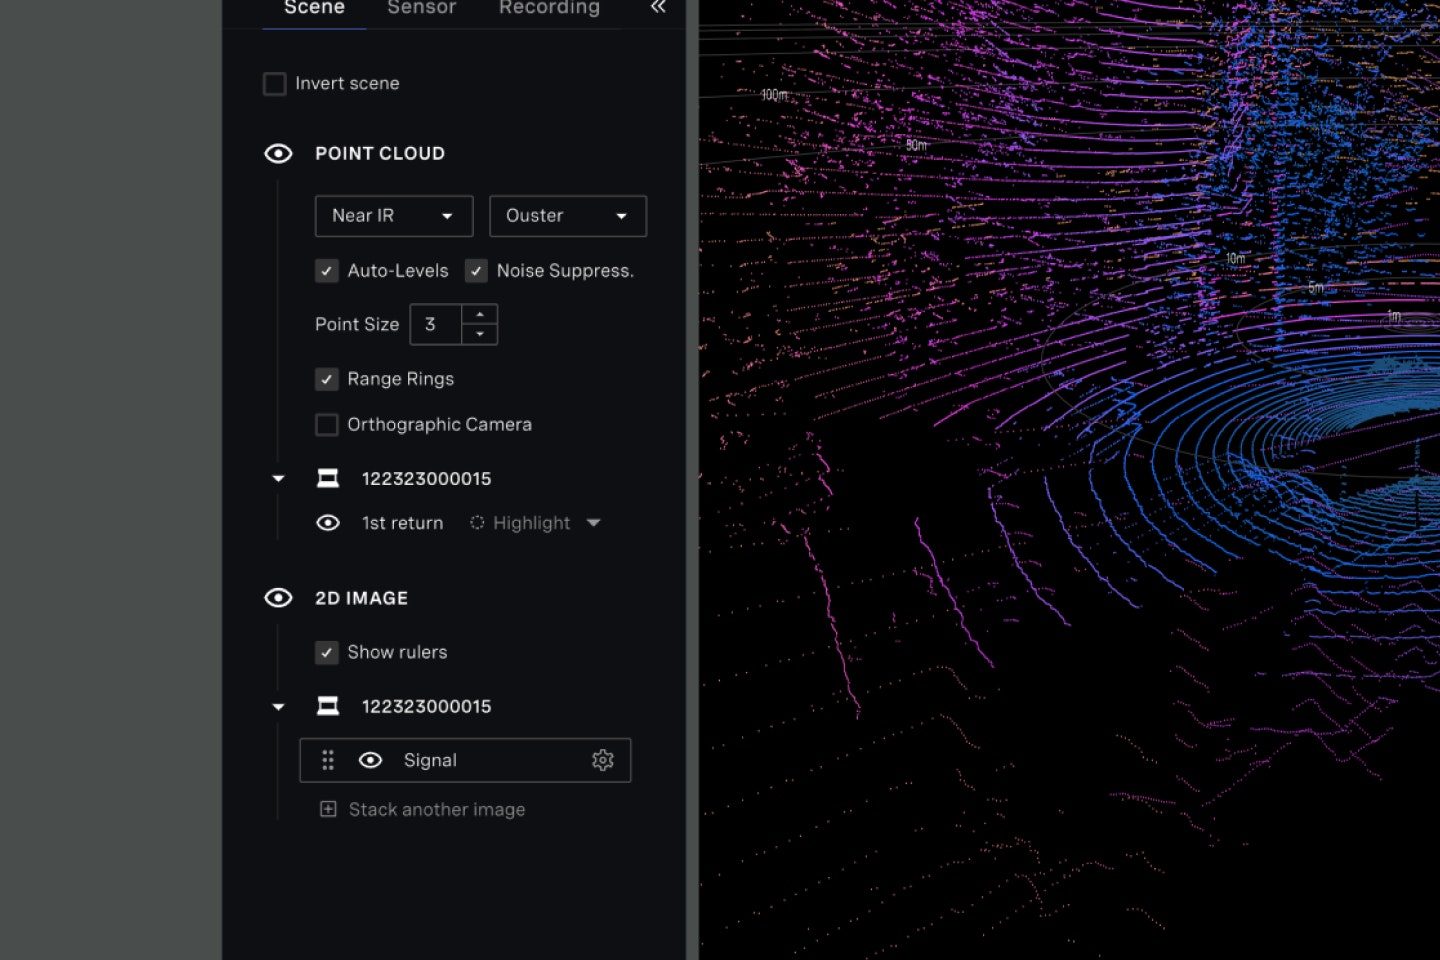
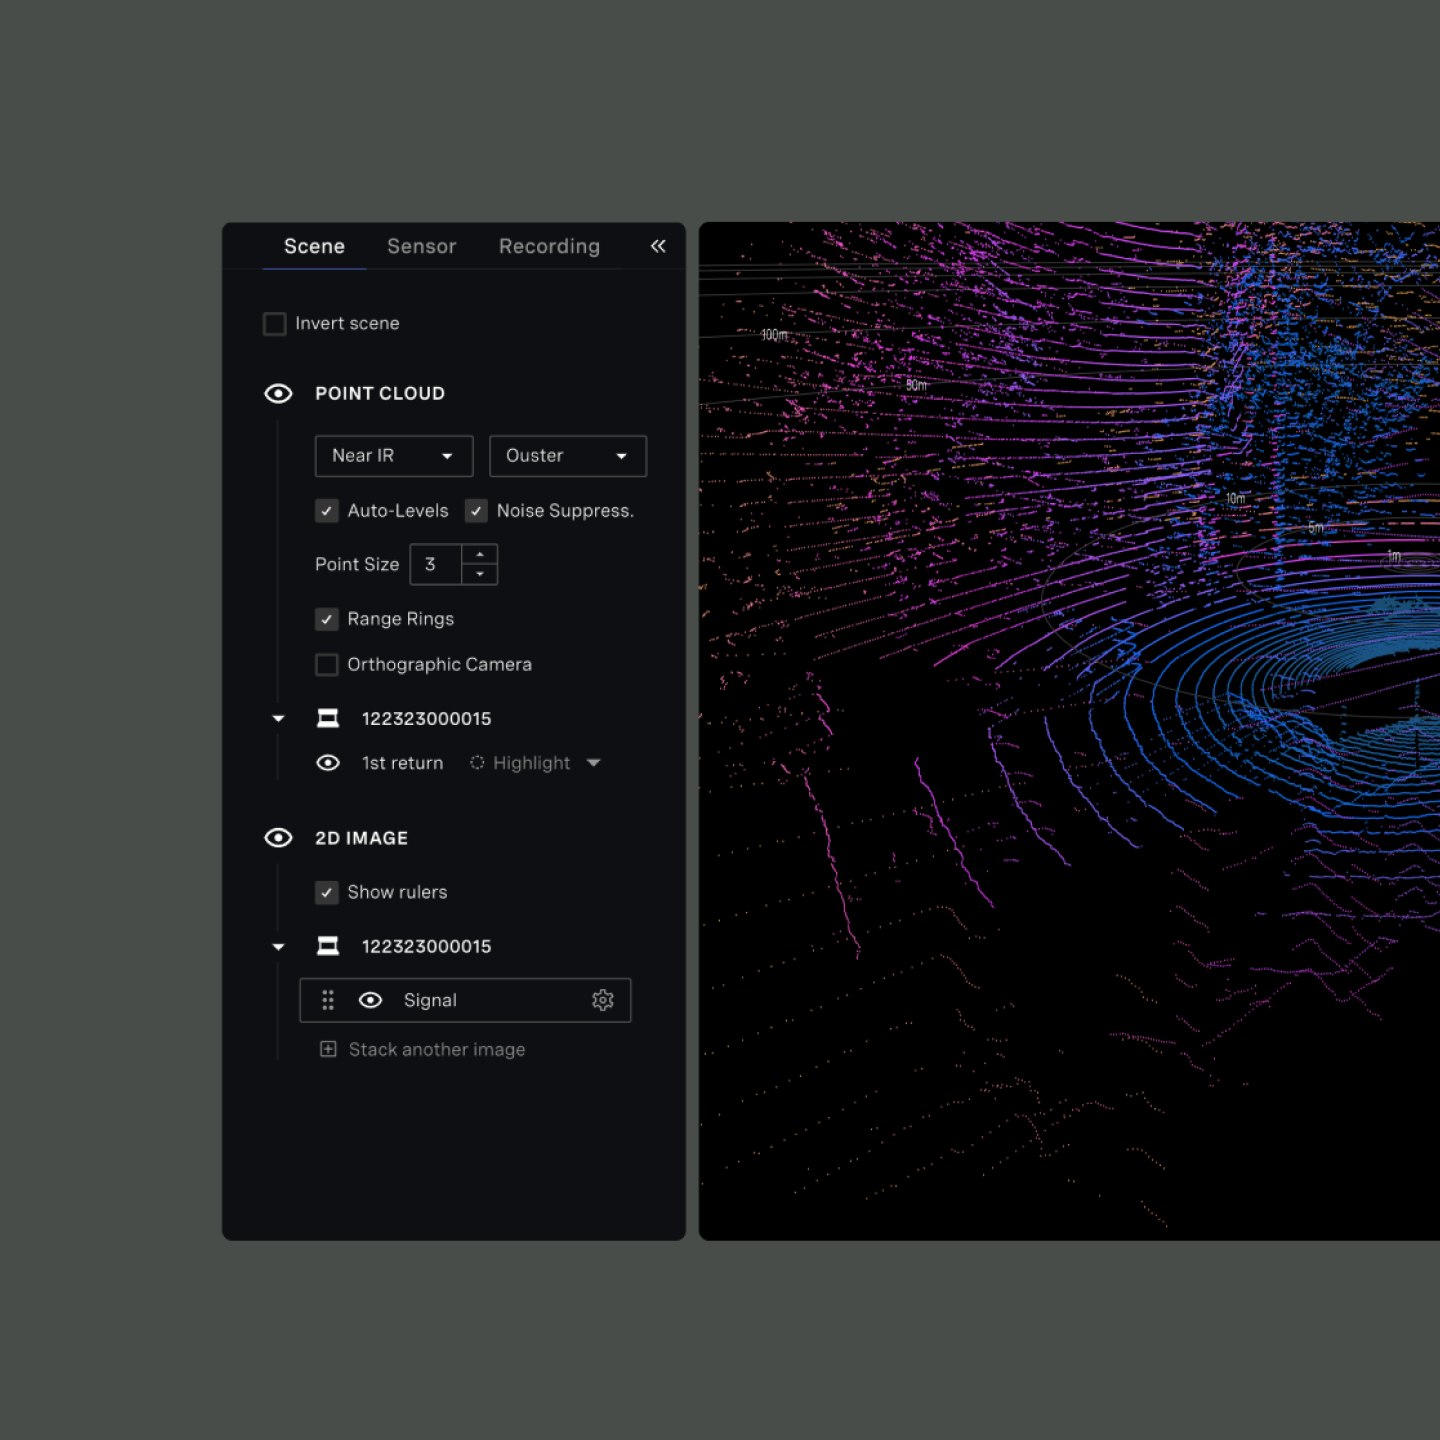
Ouster Studio is a free digital lidar visualizer for web and desktop
Ouster Studio enables users to upload, view, organize and share lidar point cloud data captured by Ouster OS series lidar sensors. Within both the web and desktop application, users can also view and download sample data, and generate automatic SLAM maps on data uploads. The desktop application allows for live streaming and recording of lidar data, as well as an in-app connection to the cloud for data uploading and sharing.
See how it works
Easy lidar data sharing, through the browser desktop app

While Ouster Studio desktop remains a powerful tool for real-time visualization and sensor discovery, we now offer a segregated cloud-based account for all users to privately upload data for sharing and SLAM map generation. By signing-up to the free cloud-based Ouster Studio Web interface, you can:
- Access your data from any device through the browser.
- Collaborate more efficiently with your team by sharing lidar data visualizations.
- Enjoy the benefits of secure, scalable cloud storage without the hassle of managing large files on local storage.
- Access up to 250GB of free storage.

Manage your lidar data effortlessly with Ouster Studio


Streamlined point cloud storage
Powerful and intuitive data viewing
Organize your data with ease
Effortless collaboration
View and download sample data directly
from Ouster StudioAutomatic SLAM map generation
Explore Ouster Studio on
Desktop and Web
The web version of Ouster Studio complements Ouster’s existing suite of desktop applications for Windows, Linux, and Mac. Both versions include the same new features – the only difference is that the desktop version allows you to also discover and connect directly to your sensor for live sensor views and recording capabilities.
Sign up free for Ouster Studio Web
Now, from any location with an internet connection, you can upload, manage, and organize your lidar data easily visualize and share that lidar data with people within your organization or share it publicly.
