Ouster Studio Available Now for Visualizing, Recording, and Analyzing Ouster Lidar Data
We’re excited today to announce the launch of Ouster Studio – a new plug-and-play software package to help you get a sensor up and running for evaluation in minutes. With Ouster Studio you can quickly visualize, record, and analyze Ouster lidar data. The software is available for Windows, MacOS, and Linux, and will work with your OS1-16 or OS1-64 sensor.
Ouster Studio is available for download here.
Visualizing Lidar Data:
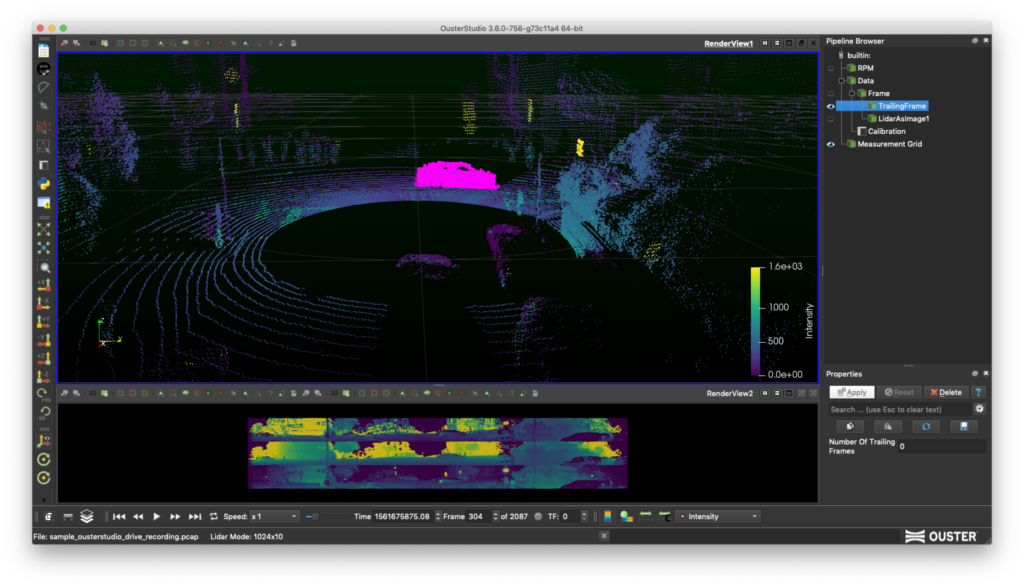
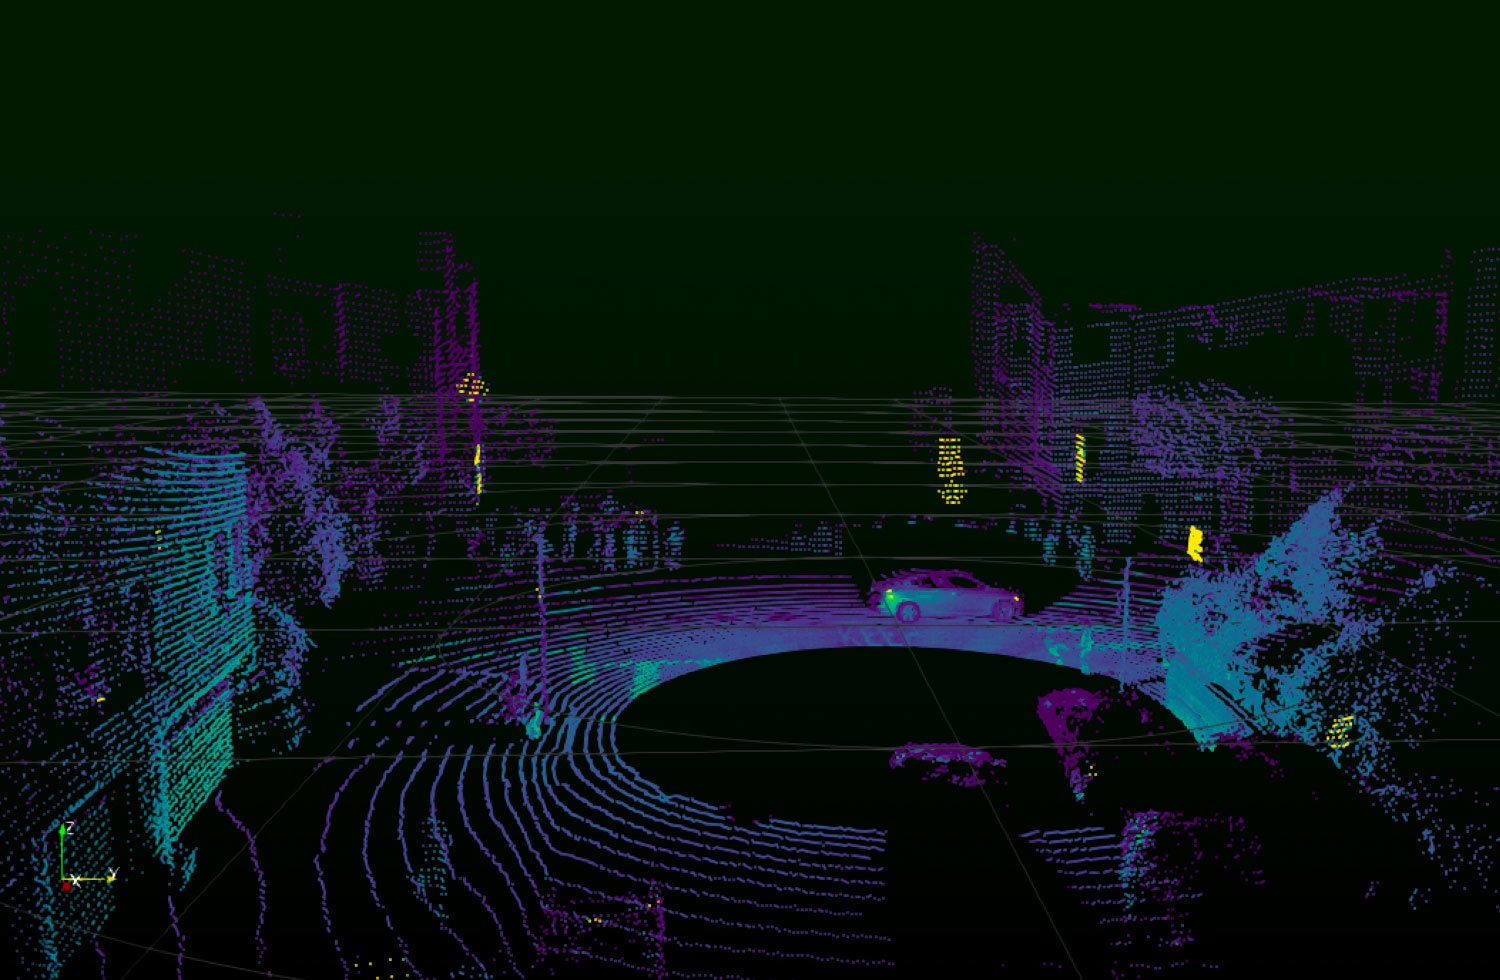
With Ouster Studio, setup is simple. Within minutes, you can plug in your sensor and begin visualizing, recording, and playing back the data. All playback modes (512×10, 1024×10, 2048×10, 512×20 and 1024×20) are supported, and you can visualize point clouds, range data, signal intensity, and ambient imagery captured using Ouster’s CMOS sensor. The new interface is shown below, visualizing our sample .pcap data from a drive through San Francisco:

Recording Lidar Data:
Once the sensor is up and you have the visualization running, making a recording is as simple as pressing the red record button on the bottom toolbar. The software is designed for testing and evaluation, so we don’t recommend recording more than a few minutes of data in a single file.

Analyzing Lidar Data:
Ouster Studio has a large suite of analytical tools that you can read more about in the User Guide.
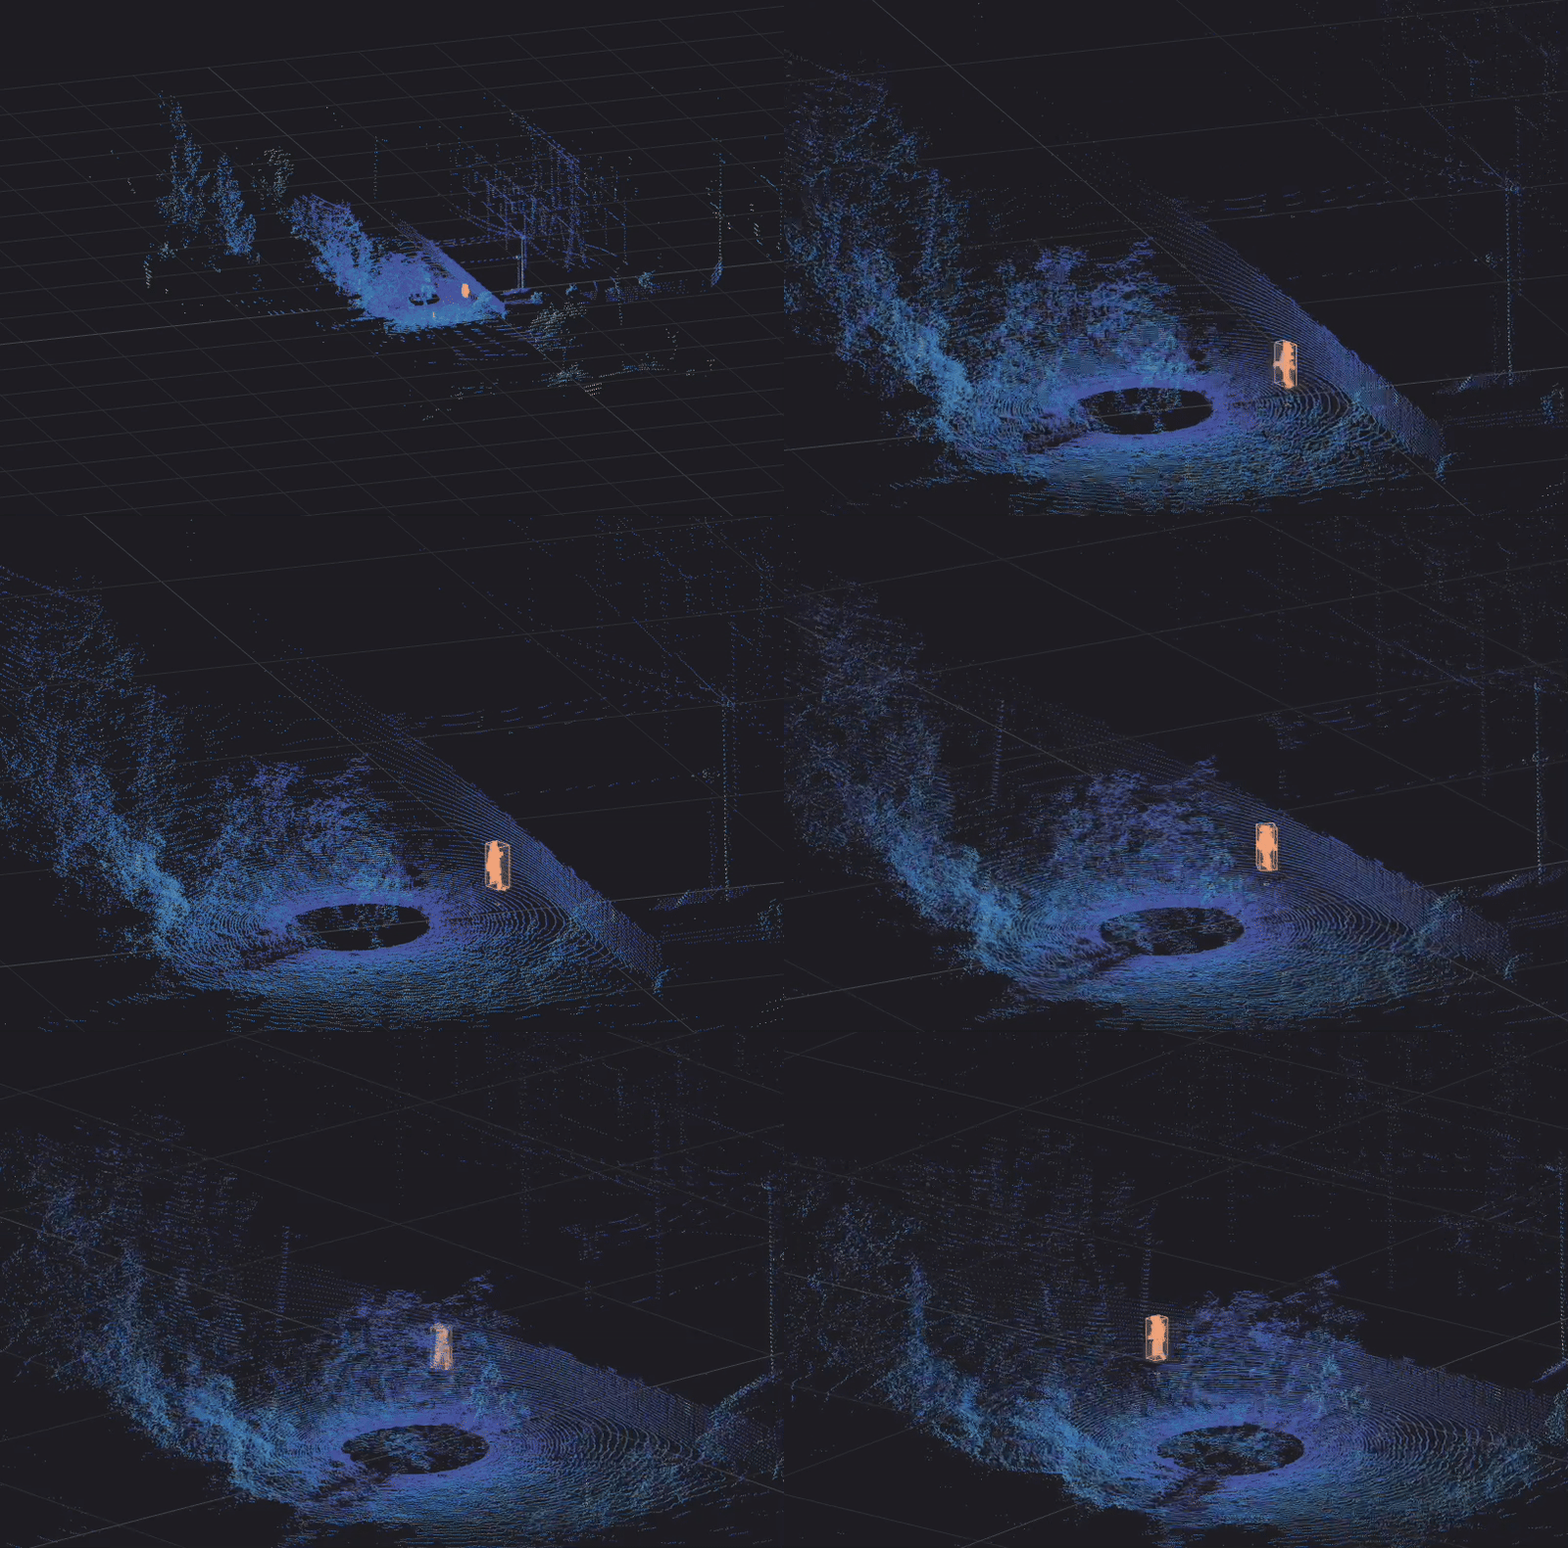
Below you can see an example of the point selector tool, which lets you highlight a subset of the voxels in your point cloud. Using these tools, you can do things like crop your returns, measure return intensity, analyze relative distances and more.

Ouster Studio is available today for download. We look forward to seeing everything that you can do with it!
If you have any questions or issues, please don’t hesitate to let us know at: [email protected]


