

January 4th, 2023. 115,000 people from across the globe arrive in Las Vegas, NV to get a first look at the tech industry’s newest innovations and headlines.
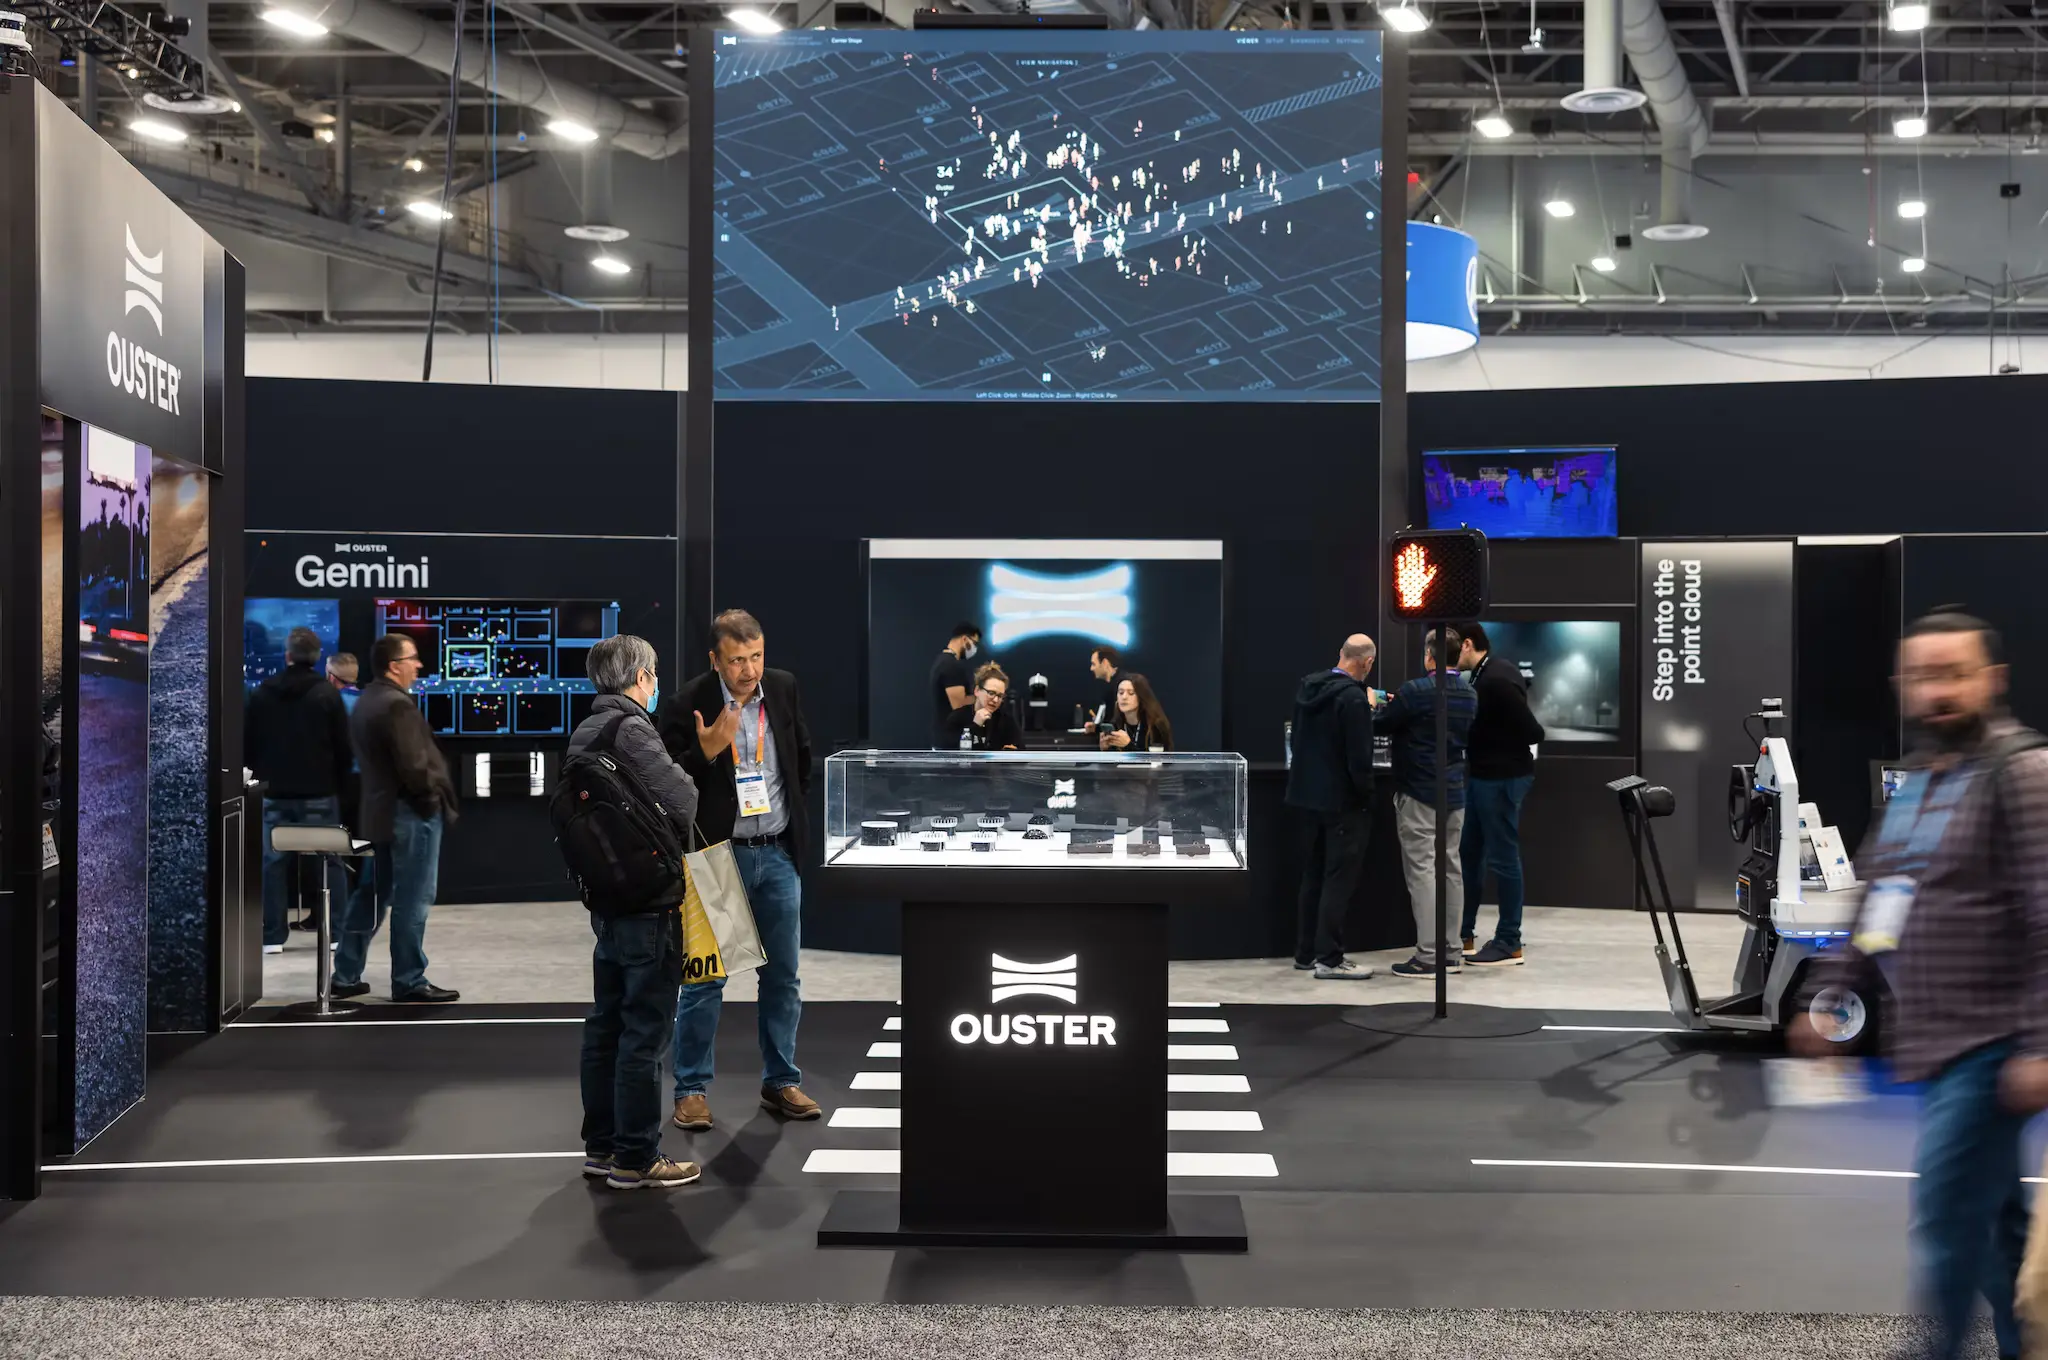
Throughout the weekend, thousands of visitors stopped to wave their hands in the air in front of our booth as they got a first look at Ouster’s new digital lidar perception platform, Gemini.
What is Ouster Gemini?
Ouster Gemini is a perception platform designed for smart infrastructure and optimized for digital lidar. We built it to address a critical need in the smart infrastructure industry: a platform that is intuitive to use and provides accurate spatial object information. Camera-based systems are complex, unreliable, and inaccurate, leading to high lifetime costs, false alarms, and missed events. Other lidar-based systems do not leverage the true power of high-resolution digital lidar and are cumbersome to integrate. Customers need a better, simplified solution. Gemini is that solution.
The art of understanding the flow of people in a particular setting is often called crowd analytics. This is a large and fast-growing industry with CAGR of 20.4% that is expected to grow to $5.7B by 20301. Ouster has partnered with some of the leading companies in this industry to enable them to use the data output from Gemini. Gemini provides unique spatial intelligence by detecting, classifying, and tracking objects with centimeter-level accuracy. Our team has purpose-built the platform to make lidar-driven insights more accessible. With Gemini, customers can cover more square feet with fewer sensors, dramatically reducing the time and cost of integration. That space is represented visually in 3D with live feeds from multiple lidar sensors, giving the user one continuous view and making it effortless to track an object across the entire area. Optimized around Ouster’s digital lidar, Gemini can detect pedestrians out to 90 m (~300 ft) in all directions with a mid-range OS1, giving users ample coverage across their entire site. Within that coverage, customers can easily configure inclusion and exclusion zones in 3D and output real-time or aggregate analytics associated with each zone. We go into much more detail about the fundamentals of Gemini in our recent blog post here.
The data output from Gemini is ingested by customer-configured end-points such as dashboards and reports, allowing users to visualize data in the form of heatmaps, histograms, customer journey maps, etc. The analytics, visuals, and reports shown in this blog were developed for demonstration purposes only to show the power of what is possible. Ouster teams up with preferred partners to deliver production-level analytics and dashboard capabilities to customers around the world.
Gemini combines all of these features in one simple platform that outputs rich data that can be used to proactively monitor high-security areas, provide profit-driving insights for retail analytics, keep vulnerable road users safe in ITS (Intelligent Transportation Systems) settings, and much more.
So naturally, at CES 2023, we wanted to show how Gemini can bring a new level of spatial intelligence to the crowded show floor.
Booth analytics setup
Crowd analytics can be applied in countless settings to provide valuable insight. From large public venues like transportation hubs and stadiums to retail stores or gas stations, there is a gold mine of value to be extracted from understanding people’s movement and behavior.
But instead of trying to explain what you can do with the power of Gemini, we thought we could do something more interesting and show you. Our booth at CES provided a perfect setting for us to analyze the crowd and pull out insights to help us optimize our booth next year.
We installed the Ouster Gemini system into our booth, with 4 sensors (2 x OSDome, 1 x OS0, and 1 x OS1) placed in different parts of our booth to provide full coverage of the space and immediate surrounding areas. Here’s what that setup looked like:
Gemini sensor setup at the Ouster CES booth
Now that we had the space covered by those 4 sensors, we created zones for all key areas of the booth, and around the booth, that we wanted to analyze. With zones defined, we were able to track visitor engagement with specific products, demos, and partners, helping us better understand what worked and didn’t work for future shows. Our zone setup looks like this:
The entire setup process is simplified within the Gemini user interface. Users can easily drag and drop sensors and seamlessly mesh together their point clouds for continuous coverage over the space. The tool also makes it easy to set up zones and define their parameters (event/inclusion/exclusion). After the lidar sensors were installed throughout the booth, the sensor configuration and zone creation were done in minutes and the entire Gemini system was up and running in less than one hour.

Gemini custom zone configuration for visitor movement analysis
Defining Visitor Behavior
Okay, now we’re ready to go. So the first bit of data that we wanted to understand is what our conversion rate was from people walking by the booth to people who entered the booth. Given the nature of how people walk through booths at trade shows, we had to get a little bit involved and define three categories of potential visitors: “Pass-by,” “Pass-through,” and “Visitor.” The key category is the “Pass-through” visitor, who walked through our booth but likely as a shortcut on the way to somewhere else. Conceptually, we defined the categories like this:

People behavior definitions behind the Gemini CES booth analytics
This is a key insight, and one that is possible with Gemini, but would not be easily achievable with a simple door counter or camera-based system.
Now, let’s dive into the data-driven insights that we learned about our CES booth through Gemini. We are going to highlight three core crowd analytics insights and what they can be used for: draw, intent, and engagement.
Draw
Draw data illustrates the success rate of drawing visitors into your space. The core draw metric is the number of people who walk into your space vs. the number of people who pass by your space without entering. This insight can be used to answer important questions about overall performance such as:
- How Many People Walk By My Store/Site vs. Entering?
- How Do My Stores/Sites Compare Against Each Other?
- How Do I Compare Against My Neighbors?

As we analyzed our draw data, we were encouraged to see that while overall show traffic decreased significantly as the show progressed into the weekend, our draw remained relatively constant. This means that our booth demos were engaging enough to maintain good traction even though the bulk of visitors had left the show.
Benchmarking draw data is critical for retail stores to do things like A-B testing of sidewalk or window advertisements. Large airports can use draw insights to understand what stores, kiosks, or other zones attract traveler engagement versus those people heading straight for their departure gate. The outcome of all of this: make data-informed decisions that drive more profit and improve customer experience.
Intent
Intent metrics are gathered to make inferences about what customers want. As people are monitored throughout a retail store, for example, 3D spatial intelligence can reveal why they came to the store initially and how engagement with products or employees influences further behaviors.
- What Is The First Location My Customers Visit?
- Where Do My Customers Go From There?
- Do My Customers Make A Purchase (visit POS)?
Gemini tracked over 400 unique visitors simultaneously in and around the Ouster booth
As we analyzed the movement of individuals throughout our booth, we were able to identify the most popular demo sections and, just as importantly, the least popular (to better optimize for next year). Along with our sensor demos and conference room meetings, we realized just how influential our partner demo sections were on visitors. These insights will help us make decisions on partner placement and booth design that will help attract and keep customers in our booth longer next year.

Visitor journey analytics at the Ouster booth
In the retail space, intent insights can help a store redesign its floor plan according to what customers are interested in the most. For example, a store could place a popular new product promotion in the rear of the store to examine if customers engage with other products that they see on the way.
Engagement
Engagement insight provides information about how customers interact with products or employee support. Understanding customer engagement can be used to inform profit-boosting changes to product placement or to reduce costs from inefficient staffing.
- Can I position engaging product material to better optimize customer exposure?
- Am I missing sales opportunities by understaffing during peak times and in popular areas?
- Am I wasting money due to overstaffing?
At our booth, we used this data to get a feel for how our booth staffing compared to booth traffic, hoping to identify mismatches.
Our data revealed two obvious gaps in our staff optimization. First, we found that there were large amounts of visitors “roaming” our booth during the lunchtime hours. Visitors were identified as “roaming” if they spent at least 30 seconds in our booth without stopping in any specific zone for more than 60 seconds. With that insight, we can make adjustments to our midday staffing at next year’s show to ensure we do not miss potential customers.

Booth visitor engagement trends to infer staffing gaps
Another insight we realized from overall engagement traffic was that the number of visitors to our booth decreased significantly as the weekend progressed. Our booth was overstaffed for the majority of Saturday and Sunday. By sending 10 staff members home during the lower traffic days of the show, we can save about $10,000 on hotel costs alone. On a macro scale such as big box retail (think your local warehouse retailer on a Saturday), savings from dynamic staffing optimization can be orders of magnitude larger than our simple booth example.
Gemini takes the noise out of crowds
Whether you are trying to optimize marketing efforts at a trade show, maximize retail profits, or improve traffic flow efficiency in a transportation hub, spatial intelligence is a critical piece of the puzzle. We hope Ouster Gemini at CES 2023 helped demonstrate the power, and accessibility, of digital lidar-powered insights in crowd analytics.
Gemini is already being installed to monitor crowds in stores, casinos, stadiums, and transportation hubs all around the world. We can’t wait to show off how our customers are using it to generate significant business impact and improve quality of life. Stay tuned for more.
If you would like to learn more about Gemini, reach out to us here. We would love to help you understand how you could leverage Gemini to improve your business.
(1) Allied Market Research. (April 2022). Crowd Analytics Market by Solutions (Software, Service), by Deployment Mode (On-premise, Cloud), by Application (Mobility and Tracking, Crowd Flow Management, Safety and Security, Others), by End User (Transportation, Retail, Hospitality and Tourism, Others): Global Opportunity Analysis and Industry Forecast, 2020-2030 (A01856). Allied Market Research.. https://www.alliedmarketresear... . Feb 16, 2023.
Related Articles

Setting a new standard in ITS: Ouster BlueCity with Rev8 steals the show at ITS America
Recap from ITS America in Detroit. Ouster BlueCity with Rev8 brings the world's first native color lidar to traffic management, delivering up to 500 feet of multimodal advance detection, with the first deployment streaming from Stamford, CT.

ITS World Congress 2025: Ouster BlueCity in Action
August 25th - 28th in Atlanta, Georgia

NJDOT
Ouster BlueCity to be deployed at 42 urban highway locations covering mainline and ramps close to the MetLife Stadium The deployments are part of New Jersey Department of Transportation’s (NJDOT) project representing the largest and fastest Intelligent Transportation System (ITS) deployment in the State’s history.NJDOT’s project integrates Ouster BlueCity into the statewide Advanced Traffic Management System (ATMS) for enhanced mobility and safety.